Bank of America 2005 Annual Report Download - page 52
Download and view the complete annual report
Please find page 52 of the 2005 Bank of America annual report below. You can navigate through the pages in the report by either clicking on the pages listed below, or by using the keyword search tool below to find specific information within the annual report.-
 1
1 -
2
-
3
-
4
-
5
-
6
-
7
-
8
-
9
-
10
-
11
-
12
-
13
-
14
-
15
-
16
-
17
-
18
-
19
-
20
-
21
-
22
-
23
-
24
-
25
-
26
-
27
-
28
-
29
-
30
-
31
-
32
-
33
-
34
-
35
-
36
-
37
-
38
-
39
-
40
-
41
-
 42
42 -
 43
43 -
 44
44 -
 45
45 -
 46
46 -
 47
47 -
 48
48 -
 49
49 -
 50
50 -
 51
51 -
 52
52 -
 53
53 -
 54
54 -
 55
55 -
 56
56 -
 57
57 -
 58
58 -
 59
59 -
 60
60 -
 61
61 -
 62
62 -
63
-
64
-
65
-
66
-
67
-
68
-
69
-
70
-
71
-
72
-
73
-
74
-
75
-
76
-
77
-
78
-
79
-
80
-
81
-
82
-
83
-
84
-
85
-
86
-
87
-
88
-
89
-
90
-
91
-
92
-
93
-
94
-
95
-
96
-
97
-
98
-
99
-
100
-
101
-
102
-
103
-
104
-
105
-
106
-
107
-
108
-
109
-
110
-
111
-
112
-
113
-
114
-
115
-
116
-
117
-
118
-
119
-
120
-
121
-
122
-
123
-
124
-
125
-
126
-
127
-
128
-
129
-
130
-
131
-
132
-
133
-
134
-
135
-
136
-
137
-
138
-
139
-
140
-
141
-
142
-
143
-
144
-
145
-
146
-
147
-
148
-
149
-
150
-
151
-
152
-
153
-
154
-
155
-
156
-
157
-
158
-
159
-
160
-
161
-
162
-
163
-
164
-
165
-
166
-
167
-
168
-
169
-
170
-
171
-
172
-
173
-
174
-
175
-
176
-
177
-
178
-
179
-
180
-
181
-
182
-
183
-
184
-
185
-
186
-
187
-
188
-
189
-
190
-
191
-
192
-
193
-
194
-
195
-
196
-
197
-
198
-
199
-
200
-
201
-
202
-
203
-
204
-
205
-
206
-
207
-
208
-
209
-
210
-
211
-
212
-
213
 |
 |

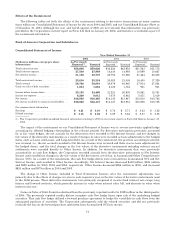
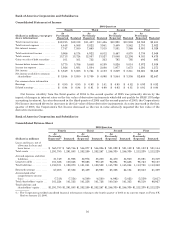
Bank of America Corporation and Subsidiaries
Consolidated Statement of Income
2004 Quarters
Fourth Third Second First
(Dollars in millions, except per
share information)
As
Previously
Reported Restated
As
Previously
Reported Restated
As
Previously
Reported Restated
As
Previously
Reported Restated
Totalinterestincome.............. $12,195 $12,138 $11,487 $11,456 $10,990 $10,908 $8,552 $8,451
Total interest expense ............. 4,448 4,588 3,822 3,941 3,409 3,542 2,751 2,922
Netinterestincome ............... 7,747 7,550 7,665 7,515 7,581 7,366 5,801 5,529
Total noninterest income .......... 5,966 6,174 4,922 6,012 5,467 4,870 3,730 3,949
Total revenue .................... 13,713 13,724 12,587 13,527 13,048 12,236 9,531 9,478
Gains on sales of debt securities .... 101 101 732 333 795 795 495 495
Income before income taxes ........ 5,775 5,786 5,648 6,189 5,826 5,014 3,972 3,919
Income tax expense ............... 1,926 1,931 1,884 2,086 1,977 1,673 1,291 1,271
Netincome ...................... $ 3,849 $ 3,855 $ 3,764 $ 4,103 $ 3,849 $ 3,341 $2,681 $2,648
Net income available to common
shareholders ................... $ 3,844 $ 3,850 $ 3,759 $ 4,098 $ 3,844 $ 3,336 $2,680 $2,647
Per common share information
Earnings ........................ $ 0.95 $ 0.95 $ 0.93 $ 1.01 $ 0.95 $ 0.82 $ 0.93 $ 0.92
Dilutedearnings.................. $ 0.94 $ 0.94 $ 0.91 $ 0.99 $ 0.93 $ 0.81 $ 0.91 $ 0.90
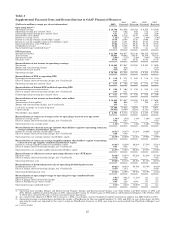
Net Income volatility from the third quarter of 2004 to the second quarter of 2005 was primarily driven by the
impact of changes in interest rates on the fair value of derivative instruments which did not qualify for SFAS 133 hedge
accounting treatment. As rates decreased in the third quarter of 2004 and the second quarter of 2005, the Corporation’s
Net Income increased driven by increases in the fair value of these derivative instruments. As rates increased in the first
quarter of 2005, the Corporation’s Net Income decreased as the rise in rates adversely impacted the fair value of the
derivative instruments.
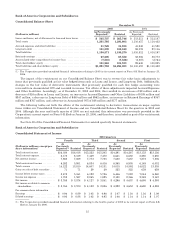
Bank of America Corporation and Subsidiaries
Consolidated Balance Sheet
2005 Quarters
Fourth Third Second First
(Dollars in millions)
As
Previously
Reported(1) Restated
As
Previously
Reported Restated
As
Previously
Reported Restated
As
Previously
Reported Restated
Loans and leases, net of
allowance for loan and
lease losses .............. $ 565,737 $ 565,746 $ 546,277 $ 546,286 $ 521,099 $ 521,109 $ 521,153 $ 521,144
Total assets ............... 1,291,795 1,291,803 1,252,259 1,252,267 1,246,330 1,246,339 1,212,239 1,212,229
Accrued expenses and other
liabilities ................ 31,749 31,938 32,976 33,250 34,470 34,940 35,081 35,319
Long-term debt ............ 101,338 100,848 99,885 99,149 96,894 95,638 98,763 98,107
Total liabilities ............. 1,190,571 1,190,270 1,151,001 1,150,539 1,145,790 1,145,004 1,113,720 1,113,302
Retainedearnings .......... 67,205 67,552 65,439 65,980 63,328 64,154 60,843 61,309
Accumulated other
comprehensive income
(loss) ................... (7,518) (7,556) (6,509) (6,580) (4,992) (5,023) (5,559) (5,617)
Total shareholders’ equity . . . 101,224 101,533 101,258 101,728 100,540 101,335 98,519 98,927
Total liabilities and
shareholders’ equity ...... $1,291,795 $1,291,803 $1,252,259 $1,252,267 $1,246,330 $1,246,339 $1,212,239 $1,212,229
(1) The Corporation provided unaudited financial information relating to the fourth quarter of 2005 in its current report on Form 8-K
filed on January 23, 2006.
16