Bank of America 2005 Annual Report Download - page 151
Download and view the complete annual report
Please find page 151 of the 2005 Bank of America annual report below. You can navigate through the pages in the report by either clicking on the pages listed below, or by using the keyword search tool below to find specific information within the annual report.-
 1
1 -
2
-
3
-
4
-
5
-
6
-
7
-
8
-
9
-
10
-
11
-
12
-
13
-
14
-
15
-
16
-
17
-
18
-
19
-
20
-
21
-
22
-
23
-
24
-
25
-
26
-
27
-
28
-
29
-
30
-
31
-
32
-
33
-
34
-
35
-
36
-
37
-
38
-
39
-
40
-
41
-
42
-
43
-
44
-
45
-
46
-
47
-
48
-
49
-
50
-
51
-
52
-
53
-
54
-
55
-
56
-
57
-
58
-
59
-
60
-
61
-
62
-
63
-
64
-
65
-
66
-
67
-
68
-
69
-
70
-
71
-
72
-
73
-
74
-
75
-
76
-
77
-
78
-
79
-
80
-
81
-
82
-
83
-
84
-
85
-
86
-
87
-
88
-
89
-
90
-
91
-
92
-
93
-
94
-
95
-
96
-
97
-
98
-
99
-
100
-
101
-
102
-
103
-
104
-
105
-
106
-
107
-
108
-
109
-
110
-
111
-
112
-
113
-
114
-
115
-
116
-
117
-
118
-
119
-
120
-
121
-
122
-
123
-
124
-
125
-
126
-
127
-
128
-
129
-
130
-
131
-
132
-
133
-
134
-
135
-
136
-
137
-
138
-
139
-
140
-
 141
141 -
 142
142 -
 143
143 -
 144
144 -
 145
145 -
 146
146 -
 147
147 -
 148
148 -
 149
149 -
 150
150 -
 151
151 -
 152
152 -
 153
153 -
 154
154 -
 155
155 -
 156
156 -
 157
157 -
 158
158 -
 159
159 -
 160
160 -
 161
161 -
162
-
163
-
164
-
165
-
166
-
167
-
168
-
169
-
170
-
171
-
172
-
173
-
174
-
175
-
176
-
177
-
178
-
179
-
180
-
181
-
182
-
183
-
184
-
185
-
186
-
187
-
188
-
189
-
190
-
191
-
192
-
193
-
194
-
195
-
196
-
197
-
198
-
199
-
200
-
201
-
202
-
203
-
204
-
205
-
206
-
207
-
208
-
209
-
210
-
211
-
212
-
213
 |
 |

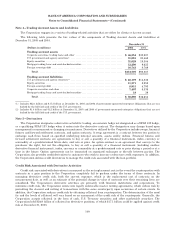
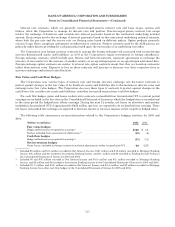
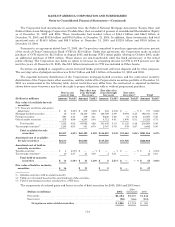
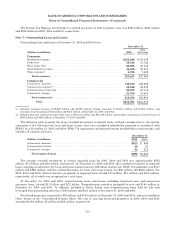
BANK OF AMERICA CORPORATION AND SUBSIDIARIES
Notes to Consolidated Financial Statements—(Continued)
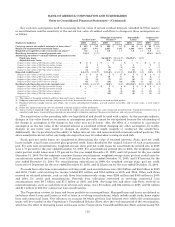
The Income Tax Expense attributable to realized net gains on debt securities sales was $400 million, $640 million
and $329 million in 2005, 2004 and 2003, respectively.
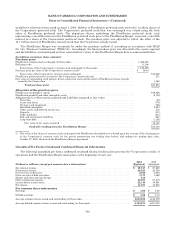
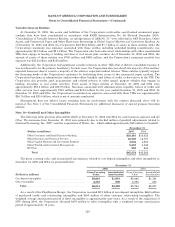
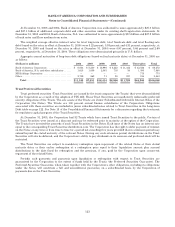
Note 7—Outstanding Loans and Leases
Outstanding loans and leases at December 31, 2005 and 2004 were:
December 31
(Dollars in millions) 2005 2004
(Restated)
Consumer
Residential mortgage ........................................................... $182,596 $178,079
Creditcard ................................................................... 58,548 51,726
Homeequitylines.............................................................. 62,098 50,126
Direct/Indirect consumer ....................................................... 45,490 40,513
Other consumer(1) .............................................................. 6,725 7,439
Total consumer .......................................................... 355,457 327,883
Commercial
Commercial—domestic ......................................................... 140,533 122,095
Commercial real estate(2) ....................................................... 35,766 32,319
Commercial lease financing ..................................................... 20,705 21,115
Commercial—foreign ........................................................... 21,330 18,401
Total commercial ........................................................ 218,334 193,930
Total ................................................................. $573,791 $521,813
(1) Includes consumer finance of $2,849 million and $3,395 million; foreign consumer of $3,841 million and $3,563 million; and
consumer lease financing of $35 million and $481 million at December 31, 2005 and 2004.
(2) Includes domestic commercial real estate loans of $35,181 million and $31,879 million; and foreign commercial real estate loans of
$585 million and $440 million at December 31, 2005 and 2004.
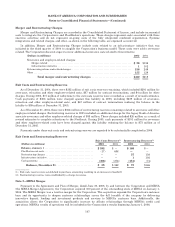
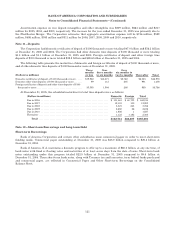
The following table presents the gross recorded investment in specific loans, without consideration to the specific
component of the Allowance for Loan and Lease Losses, that were considered individually impaired in accordance with
SFAS 114 at December 31, 2005 and 2004. SFAS 114 impairment includes performing troubled debt restructurings, and
excludes all commercial leases.
December 31
(Dollars in millions) 2005 2004
Commercial—domestic ................................................................ $613 $ 868
Commercial real estate ................................................................ 49 87
Commercial—foreign .................................................................. 34 273
Total impaired loans ............................................................ $696 $1,228
The average recorded investment in certain impaired loans for 2005, 2004 and 2003 was approximately $852
million, $1.6 billion and $3.0 billion, respectively. At December 31, 2005 and 2004, the recorded investment in impaired
loans requiring an Allowance for Loan and Lease Losses based on individual analysis per SFAS 114 guidelines was $517
million and $926 million, and the related Allowance for Loan and Lease Losses was $55 million and $202 million. For
2005, 2004 and 2003, Interest Income recognized on impaired loans totaled $17 million, $21 million and $105 million,
respectively, all of which was recognized on a cash basis.
At December 31, 2005 and 2004, nonperforming loans and leases, including impaired loans and nonaccrual
consumer loans, totaled $1.5 billion and $2.2 billion. Nonperforming securities amounted to zero and $140 million at
December 31, 2005 and 2004. In addition, included in Other Assets were nonperforming loans held for sale and
leveraged lease partnership interests of $50 million and $151 million at December 31, 2005 and 2004.
Foreclosed properties amounted to $92 million and $102 million at December 31, 2005 and 2004, and are included in
Other Assets on the Consolidated Balance Sheet. The cost of carrying foreclosed properties in 2005, 2004 and 2003
amounted to $4 million, $3 million and $3 million, respectively.
115