Bank of America 2005 Annual Report Download - page 194
Download and view the complete annual report
Please find page 194 of the 2005 Bank of America annual report below. You can navigate through the pages in the report by either clicking on the pages listed below, or by using the keyword search tool below to find specific information within the annual report.-
 1
1 -
2
-
3
-
4
-
5
-
6
-
7
-
8
-
9
-
10
-
11
-
12
-
13
-
14
-
15
-
16
-
17
-
18
-
19
-
20
-
21
-
22
-
23
-
24
-
25
-
26
-
27
-
28
-
29
-
30
-
31
-
32
-
33
-
34
-
35
-
36
-
37
-
38
-
39
-
40
-
41
-
42
-
43
-
44
-
45
-
46
-
47
-
48
-
49
-
50
-
51
-
52
-
53
-
54
-
55
-
56
-
57
-
58
-
59
-
60
-
61
-
62
-
63
-
64
-
65
-
66
-
67
-
68
-
69
-
70
-
71
-
72
-
73
-
74
-
75
-
76
-
77
-
78
-
79
-
80
-
81
-
82
-
83
-
84
-
85
-
86
-
87
-
88
-
89
-
90
-
91
-
92
-
93
-
94
-
95
-
96
-
97
-
98
-
99
-
100
-
101
-
102
-
103
-
104
-
105
-
106
-
107
-
108
-
109
-
110
-
111
-
112
-
113
-
114
-
115
-
116
-
117
-
118
-
119
-
120
-
121
-
122
-
123
-
124
-
125
-
126
-
127
-
128
-
129
-
130
-
131
-
132
-
133
-
134
-
135
-
136
-
137
-
138
-
139
-
140
-
141
-
142
-
143
-
144
-
145
-
146
-
147
-
148
-
149
-
150
-
151
-
152
-
153
-
154
-
155
-
156
-
157
-
158
-
159
-
160
-
161
-
162
-
163
-
164
-
165
-
166
-
167
-
168
-
169
-
170
-
171
-
172
-
173
-
174
-
175
-
176
-
177
-
178
-
179
-
180
-
181
-
182
-
183
-
 184
184 -
 185
185 -
 186
186 -
 187
187 -
 188
188 -
 189
189 -
 190
190 -
 191
191 -
 192
192 -
 193
193 -
 194
194 -
 195
195 -
 196
196 -
 197
197 -
 198
198 -
 199
199 -
 200
200 -
 201
201 -
 202
202 -
 203
203 -
 204
204 -
205
-
206
-
207
-
208
-
209
-
210
-
211
-
212
-
213
 |
 |

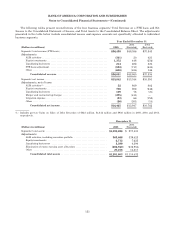
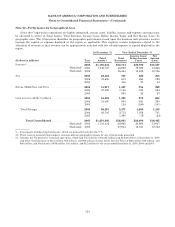
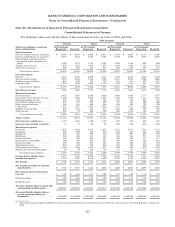
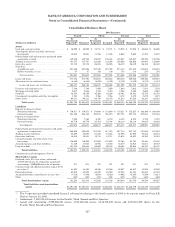
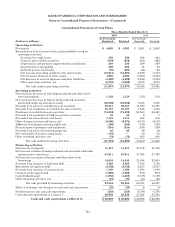
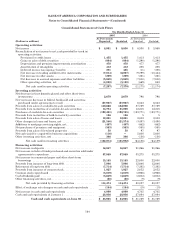
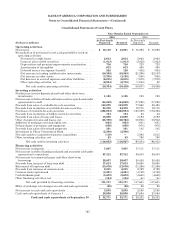
BANK OF AMERICA CORPORATION AND SUBSIDIARIES
Notes to Consolidated Financial Statements—(Continued)
Consolidated Balance Sheet
2004 Quarters
Fourth Third Second First
(Dollars in millions)
As
Previously
Reported Restated
As
Previously
Reported Restated
As
Previously
Reported Restated
As
Previously
Reported Restated
Assets
Cash and cash equivalents ............... $ 28,936 $ 28,936 $ 29,252 $ 29,252 $ 31,789 31,789 22,296 22,296
Time deposits placed and other short-term
investments .......................... 12,361 12,361 11,021 11,021 10,418 10,418 8,561 8,561
Federal funds sold and securities purchased
under agreements to resell ............. 91,360 91,360 104,570 104,570 81,437 81,437 73,057 73,057
Trading account assets ................... 93,587 93,587 102,925 102,925 85,972 85,972 75,004 75,004
Derivative assets ........................ 30,235 30,235 25,398 25,398 25,908 25,908 28,481 28,481
Securities:
Available-for-sale ..................... 194,743 194,743 163,438 163,438 166,175 166,175 139,546 139,546
Held-to-maturity, at cost ............... 330 330 420 420 478 478 242 242
Total securities ..................... 195,073 195,073 163,858 163,858 166,653 166,653 139,788 139,788
Loans and leases ........................ 521,837 521,813 511,639 511,613 498,481 498,452 375,968 375,938
Allowance for loan and lease losses ........ (8,626) (8,626) (8,723) (8,723) (8,767) (8,767) (6,080) (6,080)
Loans and leases, net of allowance ..... 513,211 513,187 502,916 502,890 489,714 489,685 369,888 369,858
Premises and equipment, net ............. 7,517 7,517 7,884 7,884 7,797 7,797 6,076 6,076
Mortgage servicing rights ................ 2,482 2,481 2,453 2,452 3,005 3,004 2,184 2,182
Goodwill ............................... 45,262 45,262 44,709 44,709 44,672 44,672 11,468 11,468
Core deposit intangibles and other
intangibles ........................... 3,887 3,887 3,726 3,726 3,922 3,922 854 854
Other assets ............................ 86,546 86,546 74,117 74,117 73,444 73,444 62,317 62,317
Total assets ..................... $1,110,457 $1,110,432 $1,072,829 $1,072,802 $1,024,731 1,024,701 799,974 799,942
Liabilities
Deposits in domestic offices:
Noninterest-bearing ................... $ 163,833 $ 163,833 $ 155,406 $ 155,406 $ 154,061 154,061 121,629 121,629
Interest-bearing....................... 396,645 396,645 380,956 380,956 369,446 369,446 267,850 267,850
Deposits in foreign offices:
Noninterest-bearing ................... 6,066 6,066 5,632 5,632 5,499 5,499 2,805 2,805
Interest-bearing....................... 52,026 52,026 49,264 49,264 46,407 46,407 43,308 43,308
Total deposits ..................... 618,570 618,570 591,258 591,258 575,413 575,413 435,592 435,592
Federal funds purchased and securities sold
under agreements to repurchase ........ 119,741 119,741 142,992 142,992 119,264 119,264 115,434 115,434
Trading account liabilities ................ 36,654 36,654 36,825 36,825 29,689 29,689 27,402 27,402
Derivative liabilities ..................... 17,928 17,928 12,721 12,721 14,381 14,381 16,290 16,290
Commercial paper and other short-term
borrowings ........................... 78,598 78,598 61,585 61,585 63,162 63,162 56,614 56,614
Accrued expenses and other liabilities ..... 41,243 41,590 28,851 29,205 28,682 28,747 18,635 19,269
Long-term debt ......................... 98,078 97,116 100,586 99,582 98,319 98,082 81,231 79,474
Total liabilities .................. 1,010,812 1,010,197 974,818 974,168 928,910 928,738 751,198 750,075
Commitments and contingencies (Note 9)
Shareholders’ equity
Preferred stock, $0.01 par value(1,2) ........ 271 271 271 271 322 322 53 53
Common stock and additional paid-in
capital, $0.01 par value(3,4) .............. 44,236 44,236 44,756 44,756 45,669 45,669 29 29
Retainedearnings....................... 58,006 58,773 55,979 56,739 54,030 54,452 51,808 52,738
Accumulated other comprehensive income
(loss) ................................ (2,587) (2,764) (2,669) (2,806) (3,862) (4,142) (2,743) (2,582)
Other.................................. (281) (281) (326) (326) (338) (338) (371) (371)
Total shareholders’ equity ....... 99,645 100,235 98,011 98,634 95,821 95,963 48,776 49,867
Total liabilities and
shareholders’ equity ......... $1,110,457 $1,110,432 $1,072,829 $1,072,802 $1,024,731 1,024,701 799,974 799,942
(1) Authorized—100,000,000 shares for the Fourth, Third, Second and First Quarters
(2) Issued and outstanding—1,090,189 shares, 1,090,189 shares, 2,292,013 shares and 1,239,563 shares for the Fourth, Third, Second
and First Quarters
(3) Authorized—7,500,000,000 shares for the Fourth, Third, Second and First Quarters
(4) Issued and outstanding—4,046,546,212 shares, 4,049,062,685 shares, 2,031,328,433 shares and 1,445,487,313 shares for the
Fourth, Third, Second and First Quarters
158