Bank of America 2005 Annual Report Download - page 77
Download and view the complete annual report
Please find page 77 of the 2005 Bank of America annual report below. You can navigate through the pages in the report by either clicking on the pages listed below, or by using the keyword search tool below to find specific information within the annual report.-
 1
1 -
2
-
3
-
4
-
5
-
6
-
7
-
8
-
9
-
10
-
11
-
12
-
13
-
14
-
15
-
16
-
17
-
18
-
19
-
20
-
21
-
22
-
23
-
24
-
25
-
26
-
27
-
28
-
29
-
30
-
31
-
32
-
33
-
34
-
35
-
36
-
37
-
38
-
39
-
40
-
41
-
42
-
43
-
44
-
45
-
46
-
47
-
48
-
49
-
50
-
51
-
52
-
53
-
54
-
55
-
56
-
57
-
58
-
59
-
60
-
61
-
62
-
63
-
64
-
65
-
66
-
 67
67 -
 68
68 -
 69
69 -
 70
70 -
 71
71 -
 72
72 -
 73
73 -
 74
74 -
 75
75 -
 76
76 -
 77
77 -
 78
78 -
 79
79 -
 80
80 -
 81
81 -
 82
82 -
 83
83 -
 84
84 -
 85
85 -
 86
86 -
 87
87 -
88
-
89
-
90
-
91
-
92
-
93
-
94
-
95
-
96
-
97
-
98
-
99
-
100
-
101
-
102
-
103
-
104
-
105
-
106
-
107
-
108
-
109
-
110
-
111
-
112
-
113
-
114
-
115
-
116
-
117
-
118
-
119
-
120
-
121
-
122
-
123
-
124
-
125
-
126
-
127
-
128
-
129
-
130
-
131
-
132
-
133
-
134
-
135
-
136
-
137
-
138
-
139
-
140
-
141
-
142
-
143
-
144
-
145
-
146
-
147
-
148
-
149
-
150
-
151
-
152
-
153
-
154
-
155
-
156
-
157
-
158
-
159
-
160
-
161
-
162
-
163
-
164
-
165
-
166
-
167
-
168
-
169
-
170
-
171
-
172
-
173
-
174
-
175
-
176
-
177
-
178
-
179
-
180
-
181
-
182
-
183
-
184
-
185
-
186
-
187
-
188
-
189
-
190
-
191
-
192
-
193
-
194
-
195
-
196
-
197
-
198
-
199
-
200
-
201
-
202
-
203
-
204
-
205
-
206
-
207
-
208
-
209
-
210
-
211
-
212
-
213
 |
 |

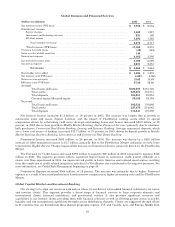
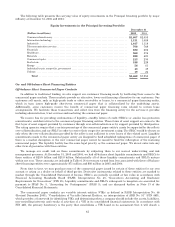
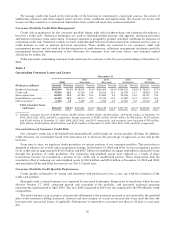
All Other
(Dollars in millions) 2005 2004
(Restated)
Net interest income (FTE basis)(1) ......................................... $ (340) $ (695)
Noninterest income:
Equity investment gains ............................................. 1,646 750
All other income(1) ................................................... (821) 241
Total noninterest income ......................................... 825 991
Total revenue (FTE basis) ............................................ 485 296
Provision for credit losses ................................................ 41 343
Gains on sales of debt securities(1) ......................................... 823 1,617
Merger and restructuring charges ......................................... 412 618
All other noninterest expense ............................................. 317 229
Income before income taxes .............................................. 538 723
Income tax expense (benefit) .............................................. (85) 120
Net income .................................................... $ 623 $ 603
Shareholder value added ................................................. $ (884) $ (531)
(1) Included in these amounts are impacts related to derivatives designated as economic hedges which do not qualify for SFAS 133
hedge accounting treatment of $(419) million and $(834) million in Net Interest Income and $(256) million and $920 million in
Noninterest Income. The impact, including $0 and a loss of $(399) million in Gains on Sales of Debt Securities, totaled $(675)
million and $(313) million in 2005 and 2004. For additional information, see Note 1 of the Consolidated Financial Statements.
Total Revenue for All Other increased $189 million to $485 million in 2005, primarily driven by an increase in
Equity Investment Gains in 2005. Offsetting this increase was the decline in fair value of derivative instruments which
were used as economic hedges of interest and foreign exchange rates as part of the ALM process. Changes in value of
these derivative instruments were due to interest rate fluctuations during the year.
Provision for Credit Losses decreased $302 million to $41 million in 2005, resulting from changes to components of
the formula and other factors effective in 2004, and reduced credit costs in 2005 associated with previously exited
businesses. These decreases were offset in part by the establishment of a $50 million reserve for estimated losses
associated with Hurricane Katrina.
Gains on Sales of Debt Securities decreased $794 million primarily due to lower gains realized in 2005 on mortgage-
backed securities and corporate bonds than in 2004. Securities gains are the result of the repositioning of the securities
portfolio to manage interest rate fluctuations and mortgage prepayment risk. The Corporation utilized a forward
purchase agreement to hedge the variability of cash flows from the anticipated purchase of securities. The Corporation
subsequently sold the related securities and did not originally reclassify the loss from Accumulated OCI at the time the
related securities were sold.
Merger and Restructuring Charges decreased $206 million in 2005 as the FleetBoston integration is nearing
completion and the infrastructure initiative was completed in the first quarter of 2005. For more information on Merger
and Restructuring Charges, see Note 2 of the Consolidated Financial Statements.
The Income Tax Expense (Benefit) was a benefit of $85 million in 2005, compared to an expense of $120 million in
2004. The change in Income Tax Expense (Benefit) was driven by an increase in tax benefits for low-income housing
credits. These tax benefits are allocated to Global Consumer and Small Business Banking as FTE Noninterest Income
through our segment reporting process. All Other includes an offset to this FTE impact.
Equity Investments
Equity Investments reported Net Income of $796 million in 2005, a $594 million improvement compared to 2004.
The improvements were primarily due to higher revenues in Principal Investing driven by increasing liquidity in the
private equity markets. When compared to the prior year, Principal Investing revenue increased $966 million to $1.4
billion. The increased revenues were driven by higher realized gains and reduced impairments compared to the prior
year.
41