Bank of America 2005 Annual Report Download - page 88
Download and view the complete annual report
Please find page 88 of the 2005 Bank of America annual report below. You can navigate through the pages in the report by either clicking on the pages listed below, or by using the keyword search tool below to find specific information within the annual report.-
 1
1 -
2
-
3
-
4
-
5
-
6
-
7
-
8
-
9
-
10
-
11
-
12
-
13
-
14
-
15
-
16
-
17
-
18
-
19
-
20
-
21
-
22
-
23
-
24
-
25
-
26
-
27
-
28
-
29
-
30
-
31
-
32
-
33
-
34
-
35
-
36
-
37
-
38
-
39
-
40
-
41
-
42
-
43
-
44
-
45
-
46
-
47
-
48
-
49
-
50
-
51
-
52
-
53
-
54
-
55
-
56
-
57
-
58
-
59
-
60
-
61
-
62
-
63
-
64
-
65
-
66
-
67
-
68
-
69
-
70
-
71
-
72
-
73
-
74
-
75
-
76
-
77
-
 78
78 -
 79
79 -
 80
80 -
 81
81 -
 82
82 -
 83
83 -
 84
84 -
 85
85 -
 86
86 -
 87
87 -
 88
88 -
 89
89 -
 90
90 -
 91
91 -
 92
92 -
 93
93 -
 94
94 -
 95
95 -
 96
96 -
 97
97 -
 98
98 -
99
-
100
-
101
-
102
-
103
-
104
-
105
-
106
-
107
-
108
-
109
-
110
-
111
-
112
-
113
-
114
-
115
-
116
-
117
-
118
-
119
-
120
-
121
-
122
-
123
-
124
-
125
-
126
-
127
-
128
-
129
-
130
-
131
-
132
-
133
-
134
-
135
-
136
-
137
-
138
-
139
-
140
-
141
-
142
-
143
-
144
-
145
-
146
-
147
-
148
-
149
-
150
-
151
-
152
-
153
-
154
-
155
-
156
-
157
-
158
-
159
-
160
-
161
-
162
-
163
-
164
-
165
-
166
-
167
-
168
-
169
-
170
-
171
-
172
-
173
-
174
-
175
-
176
-
177
-
178
-
179
-
180
-
181
-
182
-
183
-
184
-
185
-
186
-
187
-
188
-
189
-
190
-
191
-
192
-
193
-
194
-
195
-
196
-
197
-
198
-
199
-
200
-
201
-
202
-
203
-
204
-
205
-
206
-
207
-
208
-
209
-
210
-
211
-
212
-
213
 |
 |

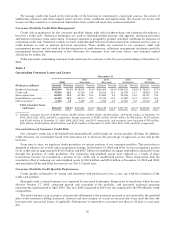
Table 10
Nonperforming Consumer Assets
December 31
(Dollars in millions) 2005 2004 2003 2002 2001
Nonperforming consumer loans and leases
Residential mortgage ............................................................. $ 570 $ 554 $ 531 $ 612 $ 556
Homeequitylines................................................................ 117 66 43 66 80
Direct/Indirect consumer ......................................................... 37 33 28 30 27
Other consumer ................................................................. 61 85 36 25 16
Total nonperforming consumer loans and leases(1) ................................ 785 738 638 733 679
Consumer foreclosed properties .................................................... 61 69 81 99 334
Total nonperforming consumer assets(2) ................................ $ 846 $ 807 $ 719 $ 832 $1,013
Nonperforming consumer loans and leases as a percentage of outstanding consumer loans
and leases (Restated) ........................................................... 0.22% 0.23% 0.27% 0.37% 0.41%
Nonperforming consumer assets as a percentage of outstanding consumer loans, leases
and foreclosed properties (Restated) .............................................. 0.24 0.25 0.30 0.42 0.61
(1) In 2005, $50 million in Interest Income was estimated to be contractually due on nonperforming consumer loans and leases
classified as nonperforming at December 31, 2005 provided that these loans and leases had been paid according to their terms and
conditions. Of this amount, approximately $9 million was received and included in Net Income for 2005.
(2) Balances do not include $5 million, $28 million, $16 million, $41 million, and $646 million of nonperforming consumer loans held-
for-sale, included in Other Assets at December 31, 2005, 2004, 2003, 2002, and 2001, respectively.
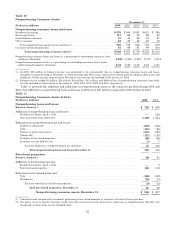
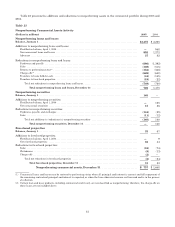
Table 11 presents the additions and reductions to nonperforming assets in the consumer portfolio during 2005 and
2004. Net additions to nonperforming loans and leases in 2005 were $47 million compared to $100 million in 2004.
Table 11
Nonperforming Consumer Assets Activity
(Dollars in millions) 2005 2004
Nonperforming loans and leases
Balance, January 1 .................................................................................. $ 738 $ 638
Additions to nonperforming loans and leases:
FleetBoston balance, April 1, 2004 ................................................................... —122
New nonaccrual loans and leases ..................................................................... 1,108 1,443
Reductions in nonperforming loans and leases:
Paydowns and payoffs .............................................................................. (223) (363)
Sales ............................................................................................. (112) (96)
Returns to performing status(1) ...................................................................... (531) (793)
Charge-offs(2) ...................................................................................... (121) (128)
Transfers to foreclosed properties .................................................................... (69) (86)
Transfers to loans held-for-sale ...................................................................... (5) 1
Total net additions to nonperforming loans and leases .............................................. 47 100
Total nonperforming loans and leases, December 31 ....................................... 785 738
Foreclosed properties
Balance, January 1 .................................................................................. 69 81
Additions to foreclosed properties:
FleetBoston balance, April 1, 2004 ................................................................... —5
New foreclosed properties ........................................................................... 125 119
Reductions in foreclosed properties:
Sales ............................................................................................. (108) (123)
Writedowns ....................................................................................... (25) (13)
Total net reductions in foreclosed properties ....................................................... (8) (12)
Total foreclosed properties, December 31 ................................................. 61 69
Nonperforming consumer assets, December 31 ............................. $ 846 $ 807
(1) Consumer loans are generally returned to performing status when principal or interest is less than 90 days past due.
(2) Our policy is not to classify consumer credit card and consumer non-real estate loans and leases as nonperforming; therefore, the
charge-offs on these loans are not included above.
52