Bank of America 2005 Annual Report Download - page 65
Download and view the complete annual report
Please find page 65 of the 2005 Bank of America annual report below. You can navigate through the pages in the report by either clicking on the pages listed below, or by using the keyword search tool below to find specific information within the annual report.-
 1
1 -
2
-
3
-
4
-
5
-
6
-
7
-
8
-
9
-
10
-
11
-
12
-
13
-
14
-
15
-
16
-
17
-
18
-
19
-
20
-
21
-
22
-
23
-
24
-
25
-
26
-
27
-
28
-
29
-
30
-
31
-
32
-
33
-
34
-
35
-
36
-
37
-
38
-
39
-
40
-
41
-
42
-
43
-
44
-
45
-
46
-
47
-
48
-
49
-
50
-
51
-
52
-
53
-
54
-
 55
55 -
 56
56 -
 57
57 -
 58
58 -
 59
59 -
 60
60 -
 61
61 -
 62
62 -
 63
63 -
 64
64 -
 65
65 -
 66
66 -
 67
67 -
 68
68 -
 69
69 -
 70
70 -
 71
71 -
 72
72 -
 73
73 -
 74
74 -
 75
75 -
76
-
77
-
78
-
79
-
80
-
81
-
82
-
83
-
84
-
85
-
86
-
87
-
88
-
89
-
90
-
91
-
92
-
93
-
94
-
95
-
96
-
97
-
98
-
99
-
100
-
101
-
102
-
103
-
104
-
105
-
106
-
107
-
108
-
109
-
110
-
111
-
112
-
113
-
114
-
115
-
116
-
117
-
118
-
119
-
120
-
121
-
122
-
123
-
124
-
125
-
126
-
127
-
128
-
129
-
130
-
131
-
132
-
133
-
134
-
135
-
136
-
137
-
138
-
139
-
140
-
141
-
142
-
143
-
144
-
145
-
146
-
147
-
148
-
149
-
150
-
151
-
152
-
153
-
154
-
155
-
156
-
157
-
158
-
159
-
160
-
161
-
162
-
163
-
164
-
165
-
166
-
167
-
168
-
169
-
170
-
171
-
172
-
173
-
174
-
175
-
176
-
177
-
178
-
179
-
180
-
181
-
182
-
183
-
184
-
185
-
186
-
187
-
188
-
189
-
190
-
191
-
192
-
193
-
194
-
195
-
196
-
197
-
198
-
199
-
200
-
201
-
202
-
203
-
204
-
205
-
206
-
207
-
208
-
209
-
210
-
211
-
212
-
213
 |
 |
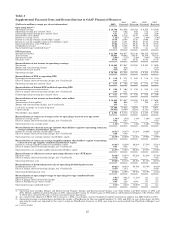
to the growth in new accounts. Mortgage Banking Income increased primarily due to a $400 million decrease in the
impairment of MSRs. Also impacting these increases was the impact of FleetBoston.
The Provision for Credit Losses increased $938 million, or 28 percent, to $4.3 billion in 2005 mainly due to credit
card. For further discussion of the increased Provision for Credit Losses related to credit card, see the following section,
Card Services.
Noninterest Expense grew $885 million, or seven percent in 2005. The majority of the increase was due to the
impact of FleetBoston and NPC.
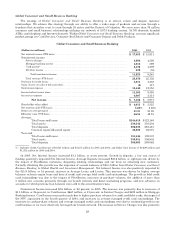
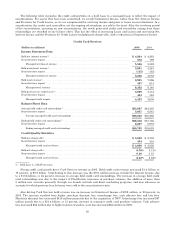
Card Services
Card Services, which excludes debit cards, provides a broad offering of credit cards to an array of customers
including consumers and small businesses. Our products include traditional credit cards, and a variety of co-branded
and affinity card products. We also provide processing services for merchant card receipts, a business where we are a
market leader, due in part to our acquisition of NPC during the fourth quarter of 2004.
We evaluate our Card Services business on both a held and managed basis (a non-GAAP measure). Managed basis
treats securitized loan receivables as if they were still on the balance sheet and presents the earnings on the sold loan
receivables as if they were not sold. We evaluate credit card operations on a managed basis as the receivables that have
been securitized are subject to the same underwriting standards and ongoing monitoring as the held loans. The credit
performance of the managed portfolio is important to understanding the results of card operations.
29