Bank of America 2005 Annual Report Download - page 53
Download and view the complete annual report
Please find page 53 of the 2005 Bank of America annual report below. You can navigate through the pages in the report by either clicking on the pages listed below, or by using the keyword search tool below to find specific information within the annual report.-
 1
1 -
2
-
3
-
4
-
5
-
6
-
7
-
8
-
9
-
10
-
11
-
12
-
13
-
14
-
15
-
16
-
17
-
18
-
19
-
20
-
21
-
22
-
23
-
24
-
25
-
26
-
27
-
28
-
29
-
30
-
31
-
32
-
33
-
34
-
35
-
36
-
37
-
38
-
39
-
40
-
41
-
42
-
 43
43 -
 44
44 -
 45
45 -
 46
46 -
 47
47 -
 48
48 -
 49
49 -
 50
50 -
 51
51 -
 52
52 -
 53
53 -
 54
54 -
 55
55 -
 56
56 -
 57
57 -
 58
58 -
 59
59 -
 60
60 -
 61
61 -
 62
62 -
 63
63 -
64
-
65
-
66
-
67
-
68
-
69
-
70
-
71
-
72
-
73
-
74
-
75
-
76
-
77
-
78
-
79
-
80
-
81
-
82
-
83
-
84
-
85
-
86
-
87
-
88
-
89
-
90
-
91
-
92
-
93
-
94
-
95
-
96
-
97
-
98
-
99
-
100
-
101
-
102
-
103
-
104
-
105
-
106
-
107
-
108
-
109
-
110
-
111
-
112
-
113
-
114
-
115
-
116
-
117
-
118
-
119
-
120
-
121
-
122
-
123
-
124
-
125
-
126
-
127
-
128
-
129
-
130
-
131
-
132
-
133
-
134
-
135
-
136
-
137
-
138
-
139
-
140
-
141
-
142
-
143
-
144
-
145
-
146
-
147
-
148
-
149
-
150
-
151
-
152
-
153
-
154
-
155
-
156
-
157
-
158
-
159
-
160
-
161
-
162
-
163
-
164
-
165
-
166
-
167
-
168
-
169
-
170
-
171
-
172
-
173
-
174
-
175
-
176
-
177
-
178
-
179
-
180
-
181
-
182
-
183
-
184
-
185
-
186
-
187
-
188
-
189
-
190
-
191
-
192
-
193
-
194
-
195
-
196
-
197
-
198
-
199
-
200
-
201
-
202
-
203
-
204
-
205
-
206
-
207
-
208
-
209
-
210
-
211
-
212
-
213
 |
 |

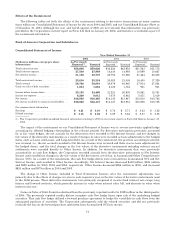
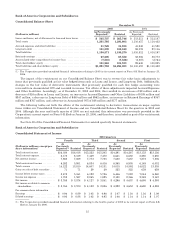
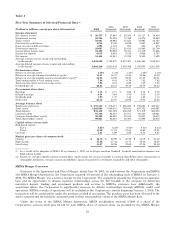
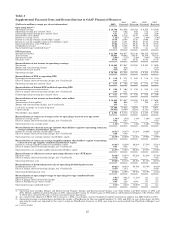
Bank of America Corporation and Subsidiaries
Consolidated Balance Sheet
2004 Quarters
Fourth Third Second First
(Dollars in millions)
As
Previously
Reported Restated
As
Previously
Reported Restated
As
Previously
Reported Restated
As
Previously
Reported Restated
Loans and leases, net of allowance
for loan and lease losses ......... $ 513,211 $ 513,187 $ 502,916 $ 502,890 $ 489,714 $ 489,685 $369,888 $369,858
Total assets ..................... 1,110,457 1,110,432 1,072,829 1,072,802 1,024,731 1,024,701 799,974 799,942
Accrued expenses and other
liabilities ...................... 41,243 41,590 28,851 29,205 28,682 28,747 18,635 19,269
Long-term debt .................. 98,078 97,116 100,586 99,582 98,319 98,082 81,231 79,474
Total liabilities ................... 1,010,812 1,010,197 974,818 974,168 928,910 928,738 751,198 750,075
Retainedearnings ................ 58,006 58,773 55,979 56,739 54,030 54,452 51,808 52,738
Accumulated other comprehensive
income (loss) ................... (2,587) (2,764) (2,669) (2,806) (3,862) (4,142) (2,743) (2,582)
Total shareholders’ equity ......... 99,645 100,235 98,011 98,634 95,821 95,963 48,776 49,867
Total liabilities and shareholders’
equity......................... $1,110,457 $1,110,432 $1,072,829 $1,072,802 $1,024,731 $1,024,701 $799,974 $799,942
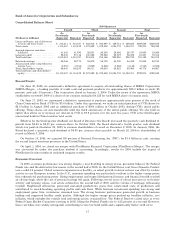
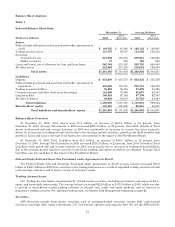
Recent Events
On June 30, 2005, we announced a definitive agreement to acquire all outstanding shares of MBNA Corporation
(MBNA Merger), a leading provider of credit card and payment products, for approximately $35.0 billion in stock (85
percent) and cash (15 percent). This transaction closed on January 1, 2006. Under the terms of the agreement, MBNA
stockholders received 0.5009 of a share of our common stock plus $4.125 for each MBNA share of common stock.
On June 17, 2005, we announced a definitive agreement to purchase approximately nine percent of the stock of
China Construction Bank (CCB) for $3.0 billion. Under this agreement, we made an initial purchase of CCB shares for
$2.5 billion in August 2005 and an additional purchase of $500 million in October 2005, during CCB’s initial public
offering. These shares are non-transferable until the third anniversary of the initial public offering. We also hold an
option that allows us to increase our interest in CCB to 19.9 percent over the next five years. CCB is the third largest
commercial bank in China based on total assets.
Effective for the third quarter dividend, our Board of Directors (the Board) increased the quarterly cash dividend 11
percent from $0.45 to $0.50 per common share. In October 2005, the Board declared a fourth quarter cash dividend
which was paid on December 23, 2005 to common shareholders of record on December 2, 2005. In January 2006, the
Board declared a quarterly cash dividend of $0.50 per common share payable on March 24, 2006 to shareholders of
record on March 3, 2006.
On October 15, 2004, we acquired 100 percent of National Processing, Inc. (NPC), for $1.4 billion in cash, creating
the second largest merchant processor in the United States.
On April 1, 2004, we closed our merger with FleetBoston Financial Corporation (FleetBoston Merger). The merger
was accounted for under the purchase method of accounting. Accordingly, results for 2004 include the impact of
FleetBoston for nine months of combined company results.
Economic Overview
In 2005, economic performance was strong, despite a near doubling in energy prices, persistent hikes in the Federal
Funds rate and the destructive hurricanes in the second half of 2005. In the United States, real Gross Domestic Product
rose a solid 3.6 percent. Global economic expansion was healthy, as robust growth in Asian nations was offset by weaker
activity in core European nations. In the U.S., consumer spending was particularly resilient to the higher energy prices
that reduced real purchasing power. Rising employment and wages lifted personal income and financial wealth reached
an all-time high, while the rate of personal savings fell again. Following several years of robust increases in real estate
activity and housing values, real estate softened in the second half of 2005 and the volume of mortgage refinancing
receded. Heightened efficiencies generated sustained productivity gains that constrained costs of production and
contributed to record-breaking operating profits and cash flows. While business investment spending was strong and
employment gains firm, inventories remained lean. The strong business performance generated growth in business
lending and supported healthy credit quality. Although the higher energy prices pushed up headline inflation, core
inflation, which excludes the volatile food and energy prices, remained low. The Federal Reserve raised rates at every
Federal Open Market Committee meeting in 2005, lifting the Federal Funds rate to 4.25 percent at year-end. However,
these rate hikes were widely anticipated, contributing to very low bond yields and a significantly flatter yield curve.
17