Bank of America 2005 Annual Report Download - page 150
Download and view the complete annual report
Please find page 150 of the 2005 Bank of America annual report below. You can navigate through the pages in the report by either clicking on the pages listed below, or by using the keyword search tool below to find specific information within the annual report.-
 1
1 -
2
-
3
-
4
-
5
-
6
-
7
-
8
-
9
-
10
-
11
-
12
-
13
-
14
-
15
-
16
-
17
-
18
-
19
-
20
-
21
-
22
-
23
-
24
-
25
-
26
-
27
-
28
-
29
-
30
-
31
-
32
-
33
-
34
-
35
-
36
-
37
-
38
-
39
-
40
-
41
-
42
-
43
-
44
-
45
-
46
-
47
-
48
-
49
-
50
-
51
-
52
-
53
-
54
-
55
-
56
-
57
-
58
-
59
-
60
-
61
-
62
-
63
-
64
-
65
-
66
-
67
-
68
-
69
-
70
-
71
-
72
-
73
-
74
-
75
-
76
-
77
-
78
-
79
-
80
-
81
-
82
-
83
-
84
-
85
-
86
-
87
-
88
-
89
-
90
-
91
-
92
-
93
-
94
-
95
-
96
-
97
-
98
-
99
-
100
-
101
-
102
-
103
-
104
-
105
-
106
-
107
-
108
-
109
-
110
-
111
-
112
-
113
-
114
-
115
-
116
-
117
-
118
-
119
-
120
-
121
-
122
-
123
-
124
-
125
-
126
-
127
-
128
-
129
-
130
-
131
-
132
-
133
-
134
-
135
-
136
-
137
-
138
-
139
-
 140
140 -
 141
141 -
 142
142 -
 143
143 -
 144
144 -
 145
145 -
 146
146 -
 147
147 -
 148
148 -
 149
149 -
 150
150 -
 151
151 -
 152
152 -
 153
153 -
 154
154 -
 155
155 -
 156
156 -
 157
157 -
 158
158 -
 159
159 -
 160
160 -
161
-
162
-
163
-
164
-
165
-
166
-
167
-
168
-
169
-
170
-
171
-
172
-
173
-
174
-
175
-
176
-
177
-
178
-
179
-
180
-
181
-
182
-
183
-
184
-
185
-
186
-
187
-
188
-
189
-
190
-
191
-
192
-
193
-
194
-
195
-
196
-
197
-
198
-
199
-
200
-
201
-
202
-
203
-
204
-
205
-
206
-
207
-
208
-
209
-
210
-
211
-
212
-
213
 |
 |

BANK OF AMERICA CORPORATION AND SUBSIDIARIES
Notes to Consolidated Financial Statements—(Continued)
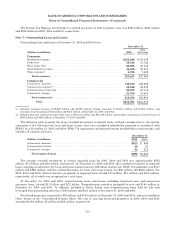
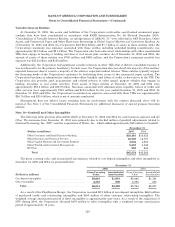
The Corporation had investments in securities from the Federal National Mortgage Association (Fannie Mae) and
Federal Home Loan Mortgage Corporation (Freddie Mac) that exceeded 10 percent of consolidated Shareholders’ Equity
as of December 31, 2005 and 2004. Those investments had market values of $144.1 billion and $46.9 billion at
December 31, 2005 and $133.6 billion and $35.8 billion at December 31, 2004. In addition, these investments had total
amortized costs of $148.0 billion and $48.3 billion at December 31, 2005 and $132.9 billion and $35.9 billion at
December 31, 2004.
Pursuant to an agreement dated June 17, 2005, the Corporation committed to purchase approximately nine percent
of the stock of China Construction Bank (CCB) for $3.0 billion. Under this agreement, the Corporation made an initial
purchase of CCB shares for $2.5 billion in August 2005 and during CCB’s initial public offering in October 2005, made
an additional purchase of $500 million. These shares are non-transferable until the third anniversary of the initial
public offering. The Corporation also holds an option to increase its ownership interest in CCB to 19.9 percent over the
next five years. At December 31, 2005, this $3.0 billion investment in CCB was included in Other Assets.
Securities are pledged or assigned to secure borrowed funds, government and trust deposits and for other purposes.
The carrying value of pledged securities was $116.7 billion and $45.1 billion at December 31, 2005 and 2004.
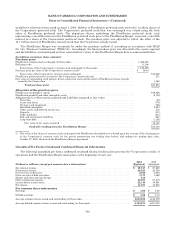
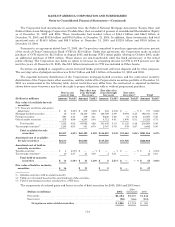
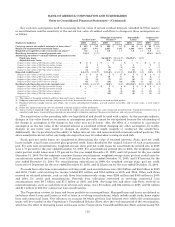
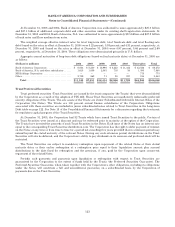
The expected maturity distribution of the Corporation’s mortgage-backed securities and the contractual maturity
distribution of the Corporation’s other securities, and the yields of the Corporation’s securities portfolio at December 31,
2005 are summarized in the following table. Actual maturities may differ from the contractual or expected maturities
shown below since borrowers may have the right to prepay obligations with or without prepayment penalties.
Due in one
year or less
Due after one
year through
five years
Due after five
years through
ten years Due after
ten years(1) Total
(Dollars in millions) Amount Yield(2) Amount Yield(2) Amount Yield(2) Amount Yield(2) Amount Yield(2)
Fair value of available-for-sale
securities
U.S. Treasury securities and agency
debentures ...................... $ 15 3.24% $ 378 3.52% $ 324 4.34% $ — — % $ 717 3.88%
Mortgage-backed securities .......... 18 4.40 56,130 4.94 126,789 5.09 9,094 5.23 192,031 5.06
Foreign securities .................. 891 4.44 339 4.41 9,620 5.66 41 6.06 10,891 5.58
Other taxable securities ............. 278 4.86 6,245 4.54 4,712 4.91 1,990 5.51 13,225 4.73
Total taxable .................. 1,202 4.52 63,092 4.89 141,445 5.13 11,125 5.28 216,864 5.06
Tax-exempt securities(3) ............. 1,255 4.53 331 6.79 2,767 5.78 339 5.67 4,692 5.50
Total available-for-sale
securities .................. $2,457 4.53% $63,423 4.90% $144,212 5.14% $11,464 5.26% $221,556 5.07%
Amortized cost of available-
for-sale securities .............. $2,514 $64,885 $147,538 $11,729 $226,666
Amortized cost of held-to-
maturity securities
Taxable securities .................. $ 4 4.00% $ — — % $ — — % $ — — % $ 4 4.00%
Tax-exempt securities(3) ............. 10 3.37 31 3.58 2 5.51 — — 43 3.61
Total held-to-maturity
securities .................. $ 14 3.38% $ 31 3.58% $ 2 5.51% $ — — % $ 47 3.65%
Fair value of held-to- maturity
securities ...................... $14 $ 31 $ 2 $ — $ 47
(1) Includes securities with no stated maturity.
(2) Yields are calculated based on the amortized cost of the securities.
(3) Yield of tax-exempt securities calculated on a FTE basis.
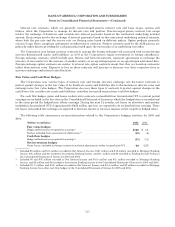
The components of realized gains and losses on sales of debt securities for 2005, 2004 and 2003 were:
(Dollars in millions) 2005 2004
(Restated) 2003
Grossgains............................................................. $1,154 $2,270 $1,246
Gross losses ............................................................ (70) (546) (305)
Net gains on sales of debt securities ................................ $ 1,084 $ 1,724 $ 941
114