Bank of America 2005 Annual Report Download - page 120
Download and view the complete annual report
Please find page 120 of the 2005 Bank of America annual report below. You can navigate through the pages in the report by either clicking on the pages listed below, or by using the keyword search tool below to find specific information within the annual report.-
 1
1 -
2
-
3
-
4
-
5
-
6
-
7
-
8
-
9
-
10
-
11
-
12
-
13
-
14
-
15
-
16
-
17
-
18
-
19
-
20
-
21
-
22
-
23
-
24
-
25
-
26
-
27
-
28
-
29
-
30
-
31
-
32
-
33
-
34
-
35
-
36
-
37
-
38
-
39
-
40
-
41
-
42
-
43
-
44
-
45
-
46
-
47
-
48
-
49
-
50
-
51
-
52
-
53
-
54
-
55
-
56
-
57
-
58
-
59
-
60
-
61
-
62
-
63
-
64
-
65
-
66
-
67
-
68
-
69
-
70
-
71
-
72
-
73
-
74
-
75
-
76
-
77
-
78
-
79
-
80
-
81
-
82
-
83
-
84
-
85
-
86
-
87
-
88
-
89
-
90
-
91
-
92
-
93
-
94
-
95
-
96
-
97
-
98
-
99
-
100
-
101
-
102
-
103
-
104
-
105
-
106
-
107
-
108
-
109
-
 110
110 -
 111
111 -
 112
112 -
 113
113 -
 114
114 -
 115
115 -
 116
116 -
 117
117 -
 118
118 -
 119
119 -
 120
120 -
 121
121 -
 122
122 -
 123
123 -
 124
124 -
 125
125 -
 126
126 -
 127
127 -
 128
128 -
 129
129 -
 130
130 -
131
-
132
-
133
-
134
-
135
-
136
-
137
-
138
-
139
-
140
-
141
-
142
-
143
-
144
-
145
-
146
-
147
-
148
-
149
-
150
-
151
-
152
-
153
-
154
-
155
-
156
-
157
-
158
-
159
-
160
-
161
-
162
-
163
-
164
-
165
-
166
-
167
-
168
-
169
-
170
-
171
-
172
-
173
-
174
-
175
-
176
-
177
-
178
-
179
-
180
-
181
-
182
-
183
-
184
-
185
-
186
-
187
-
188
-
189
-
190
-
191
-
192
-
193
-
194
-
195
-
196
-
197
-
198
-
199
-
200
-
201
-
202
-
203
-
204
-
205
-
206
-
207
-
208
-
209
-
210
-
211
-
212
-
213
 |
 |

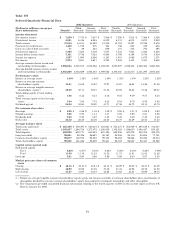
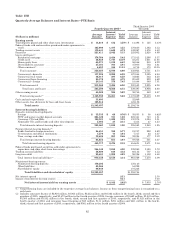
Table VII
Selected Quarterly Financial Data
2005 Quarters 2004 Quarters
(Dollars in millions, except per
share information) Fourth(2)
Third
(Restated) Second
(Restated) First
(Restated) Fourth
(Restated) Third
(Restated) Second
(Restated) First
(Restated)
Income statement
Netinterestincome .................. $ 7,859 $ 7,735 $ 7,637 $ 7,506 $ 7,550 $ 7,515 $ 7,366 $ 5,529
Noninterestincome .................. 5,951 6,416 6,955 6,032 6,174 6,012 4,870 3,949
Total revenue ....................... 13,810 14,151 14,592 13,538 13,724 13,527 12,236 9,478
Provision for credit losses ............. 1,400 1,159 875 580 706 650 789 624
Gains on sales of debt securities ....... 71 29 325 659 101 333 795 495
Noninterest expense ................. 7,320 7,285 7,019 7,057 7,333 7,021 7,228 5,430
Income before income taxes ........... 5,161 5,736 7,023 6,560 5,786 6,189 5,014 3,919
Income tax expense .................. 1,587 1,895 2,366 2,167 1,931 2,086 1,673 1,271
Netincome ......................... 3,574 3,841 4,657 4,393 3,855 4,103 3,341 2,648
Average common shares issued and
outstanding (in thousands) .......... 3,996,024 4,000,573 4,005,356 4,032,550 4,032,979 4,052,304 4,062,384 2,880,306
Average diluted common shares issued
and outstanding (in thousands) ...... 4,053,859 4,054,659 4,065,355 4,099,062 4,106,040 4,121,375 4,131,290 2,933,402
Performance ratios
Return on average assets ............. 1.09% 1.18% 1.46% 1.49% 1.33% 1.49% 1.23% 1.28%
Return on average common
shareholders’ equity ................ 14.21 15.09 18.93 17.97 15.57 16.94 14.26 21.58
Return on average tangible common
shareholders’ equity(1) .............. 29.29 30.71 39.27 37.34 32.95 35.84 31.36 29.37
Total ending equity to total ending
assets ............................ 7.86 8.12 8.13 8.16 9.03 9.19 9.37 6.23
Total average equity to total average
assets ............................ 7.64 7.80 7.72 8.25 8.54 8.78 8.59 5.92
Dividend payout ..................... 56.24 52.60 38.90 41.71 47.36 44.72 49.10 43.74
Per common share data
Earnings ........................... $0.89$ 0.96 $ 1.16 $ 1.09 $ 0.95 $ 1.01 $ 0.82 $ 0.92
Dilutedearnings..................... 0.88 0.95 1.14 1.07 0.94 0.99 0.81 0.90
Dividends paid ...................... 0.50 0.50 0.45 0.45 0.45 0.45 0.40 0.40
Bookvalue.......................... 25.32 25.28 25.16 24.45 24.70 24.29 23.54 17.23
Average balance sheet
Total loans and leases ................ $ 563,589 $ 539,497 $ 520,415 $ 524,921 $ 515,437 $ 503,049 $ 497,129 $ 374,047
Total assets ......................... 1,305,057 1,294,754 1,277,478 1,200,859 1,152,524 1,096,653 1,094,427 833,161
Total deposits ....................... 628,922 632,771 640,593 627,420 609,936 587,879 582,305 425,075
Long-term debt ...................... 99,601 98,326 96,697 96,167 98,556 98,116 94,655 77,751
Common shareholders’ equity ......... 99,677 100,974 98,558 99,130 98,452 96,268 94,024 49,314
Total shareholders’ equity ............ 99,948 101,246 98,829 99,401 98,723 96,540 94,347 49,368
Capital ratios (period end)
Risk-based capital:
Tier1 .......................... 8.25% 8.27% 8.16% 8.26% 8.20% 8.18% 8.26% 7.89%
Total ........................... 11.08 11.19 11.23 11.52 11.73 11.81 12.02 11.62
Leverage ........................... 5.91 5.90 5.66 5.86 5.89 6.00 5.87 5.55
Market price per share of common
stock
Closing ............................. $ 46.15 $ 42.10 $ 45.61 $ 44.10 $ 46.99 $ 43.33 $ 42.31 $ 40.49
Highclosing ........................ 46.99 45.98 47.08 47.08 47.44 44.98 42.72 41.38
Lowclosing ......................... 41.57 41.60 44.01 43.66 43.62 41.81 38.96 39.15
(1) Return on average tangible common shareholders’ equity equals net income available to common shareholders plus amortization of
intangibles, divided by average common shareholders’ equity less goodwill, core deposit intangibles and other intangibles.
(2) The Corporation provided unaudited financial information relating to the fourth quarter of 2005 in the current report on Form 8-K
filed on January 23, 2006.
84