Bank of America 2005 Annual Report Download - page 113
Download and view the complete annual report
Please find page 113 of the 2005 Bank of America annual report below. You can navigate through the pages in the report by either clicking on the pages listed below, or by using the keyword search tool below to find specific information within the annual report.-
 1
1 -
2
-
3
-
4
-
5
-
6
-
7
-
8
-
9
-
10
-
11
-
12
-
13
-
14
-
15
-
16
-
17
-
18
-
19
-
20
-
21
-
22
-
23
-
24
-
25
-
26
-
27
-
28
-
29
-
30
-
31
-
32
-
33
-
34
-
35
-
36
-
37
-
38
-
39
-
40
-
41
-
42
-
43
-
44
-
45
-
46
-
47
-
48
-
49
-
50
-
51
-
52
-
53
-
54
-
55
-
56
-
57
-
58
-
59
-
60
-
61
-
62
-
63
-
64
-
65
-
66
-
67
-
68
-
69
-
70
-
71
-
72
-
73
-
74
-
75
-
76
-
77
-
78
-
79
-
80
-
81
-
82
-
83
-
84
-
85
-
86
-
87
-
88
-
89
-
90
-
91
-
92
-
93
-
94
-
95
-
96
-
97
-
98
-
99
-
100
-
101
-
102
-
 103
103 -
 104
104 -
 105
105 -
 106
106 -
 107
107 -
 108
108 -
 109
109 -
 110
110 -
 111
111 -
 112
112 -
 113
113 -
 114
114 -
 115
115 -
 116
116 -
 117
117 -
 118
118 -
 119
119 -
 120
120 -
 121
121 -
 122
122 -
 123
123 -
124
-
125
-
126
-
127
-
128
-
129
-
130
-
131
-
132
-
133
-
134
-
135
-
136
-
137
-
138
-
139
-
140
-
141
-
142
-
143
-
144
-
145
-
146
-
147
-
148
-
149
-
150
-
151
-
152
-
153
-
154
-
155
-
156
-
157
-
158
-
159
-
160
-
161
-
162
-
163
-
164
-
165
-
166
-
167
-
168
-
169
-
170
-
171
-
172
-
173
-
174
-
175
-
176
-
177
-
178
-
179
-
180
-
181
-
182
-
183
-
184
-
185
-
186
-
187
-
188
-
189
-
190
-
191
-
192
-
193
-
194
-
195
-
196
-
197
-
198
-
199
-
200
-
201
-
202
-
203
-
204
-
205
-
206
-
207
-
208
-
209
-
210
-
211
-
212
-
213
 |
 |
For Intangible Assets subject to amortization, impairment exists when the carrying amount of the Intangible Asset
exceeds its fair value. An impairment loss shall be recognized only if the carrying amount of the Intangible Asset is not
recoverable and exceeds its fair value. The carrying amount of the Intangible Asset is not recoverable if it exceeds the
sum of the undiscounted cash flows expected to result from it. An Intangible Asset subject to amortization shall be tested
for recoverability whenever events or changes in circumstances, such as a significant or adverse change in the business
climate that could affect the value of the Intangible Asset, indicate that its carrying amount may not be recoverable. An
impairment loss shall be measured as the amount by which the carrying amount of the Intangible Asset exceeds its fair
value.
The fair values of the reporting units were determined using a combination of valuation techniques consistent with
the income approach and the market approach and the fair values of the Intangible Assets were determined using the
income approach. For purposes of the income approach, discounted cash flows were calculated by taking the net present
value of estimated cash flows using a combination of historical results, estimated future cash flows and an appropriate
price to earnings multiple. We use our internal forecasts to estimate future cash flows and actual results may differ from
forecasted results. However, these differences have not been material and we believe that this methodology provides a
reasonable means to determine fair values. Cash flows were discounted using a discount rate based on expected equity
return rates, which was 11 percent for 2005. Expected rates of equity returns were estimated based on historical market
returns and risk/return rates for similar industries of the reporting unit. For purposes of the market approach,
valuations of reporting units were based on actual comparable market transactions and market earnings multiples for
similar industries of the reporting unit.
Our evaluations for the year ended December 31, 2005 indicated there was no impairment of Goodwill and Other
Intangibles.
2004 Compared to 2003
The following discussion and analysis provides a comparison of our results of operations for 2004 and 2003. This
discussion should be read in conjunction with the Consolidated Financial Statements and related notes on pages 89
through 165. In addition, Tables 2 and 3 contain financial data to supplement this discussion.
Overview
Net Income
Net Income totaled $13.9 billion, or $3.64 per diluted common share, in 2004 compared to $10.8 billion, or $3.55 per
diluted common share, in 2003. The return on average common shareholders’ equity was 16.47 percent in 2004 compared
to 21.50 percent in 2003. These earnings provided sufficient cash flow to allow us to return $8.8 billion and $9.8 billion in
2004 and 2003, in capital to shareholders in the form of dividends and share repurchases, net of employee stock options
exercised.
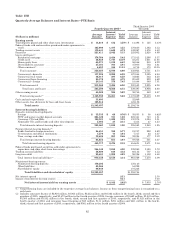
Net Interest Income
Net Interest Income on a FTE basis increased $7.5 billion to $28.7 billion in 2004. This increase was driven by the
impact of the FleetBoston Merger, higher ALM portfolio levels (primarily consisting of securities and whole loan
mortgages), the impact of higher rates, growth in consumer loan levels (primarily credit card and home equity) and
higher core deposit funding levels. Partially offsetting these increases were reductions in the large corporate and foreign
loan balances, lower trading-related contributions, lower mortgage warehouse levels and the continued runoff of
previously exited consumer businesses. The net interest yield on a FTE basis declined nine bps to 3.17 percent in 2004
due to the adverse impact of increased trading-related balances, which have a lower yield than other earning assets.
Noninterest Income
Noninterest Income increased $3.7 billion to $21.0 billion in 2004, due primarily to increases in Card Income of $1.5
billion, Service Charges of $1.4 billion, Investment and Brokerage Services of $1.2 billion, Equity Investment Gains of
$648 million, and Trading Account Profits of $461 million. Card Income increased due to increased fees and interchange
income, including the impact of the FleetBoston card portfolio. Investment and Brokerage Services increased due to the
impact of the FleetBoston business as well as market appreciation. Service Charges grew driven by organic account
growth and the impact of FleetBoston customers. Offsetting these increases was lower Mortgage Banking Income of $1.5
billion due to lower production levels, a decrease in the gains on sales of loans to the secondary market and writedowns
of the value of MSRs.
Provision for Credit Losses
The Provision for Credit Losses declined $70 million to $2.8 billion in 2004 driven by lower commercial net charge-
offs of $748 million and continued improvements in credit quality in the commercial loan portfolio. Offsetting these
decreases were increases in the Provision for Credit Losses in our consumer credit card portfolio. These increases
77