Bank of America 2005 Annual Report Download - page 177
Download and view the complete annual report
Please find page 177 of the 2005 Bank of America annual report below. You can navigate through the pages in the report by either clicking on the pages listed below, or by using the keyword search tool below to find specific information within the annual report.-
 1
1 -
2
-
3
-
4
-
5
-
6
-
7
-
8
-
9
-
10
-
11
-
12
-
13
-
14
-
15
-
16
-
17
-
18
-
19
-
20
-
21
-
22
-
23
-
24
-
25
-
26
-
27
-
28
-
29
-
30
-
31
-
32
-
33
-
34
-
35
-
36
-
37
-
38
-
39
-
40
-
41
-
42
-
43
-
44
-
45
-
46
-
47
-
48
-
49
-
50
-
51
-
52
-
53
-
54
-
55
-
56
-
57
-
58
-
59
-
60
-
61
-
62
-
63
-
64
-
65
-
66
-
67
-
68
-
69
-
70
-
71
-
72
-
73
-
74
-
75
-
76
-
77
-
78
-
79
-
80
-
81
-
82
-
83
-
84
-
85
-
86
-
87
-
88
-
89
-
90
-
91
-
92
-
93
-
94
-
95
-
96
-
97
-
98
-
99
-
100
-
101
-
102
-
103
-
104
-
105
-
106
-
107
-
108
-
109
-
110
-
111
-
112
-
113
-
114
-
115
-
116
-
117
-
118
-
119
-
120
-
121
-
122
-
123
-
124
-
125
-
126
-
127
-
128
-
129
-
130
-
131
-
132
-
133
-
134
-
135
-
136
-
137
-
138
-
139
-
140
-
141
-
142
-
143
-
144
-
145
-
146
-
147
-
148
-
149
-
150
-
151
-
152
-
153
-
154
-
155
-
156
-
157
-
158
-
159
-
160
-
161
-
162
-
163
-
164
-
165
-
166
-
 167
167 -
 168
168 -
 169
169 -
 170
170 -
 171
171 -
 172
172 -
 173
173 -
 174
174 -
 175
175 -
 176
176 -
 177
177 -
 178
178 -
 179
179 -
 180
180 -
 181
181 -
 182
182 -
 183
183 -
 184
184 -
 185
185 -
 186
186 -
 187
187 -
188
-
189
-
190
-
191
-
192
-
193
-
194
-
195
-
196
-
197
-
198
-
199
-
200
-
201
-
202
-
203
-
204
-
205
-
206
-
207
-
208
-
209
-
210
-
211
-
212
-
213
 |
 |

BANK OF AMERICA CORPORATION AND SUBSIDIARIES
Notes to Consolidated Financial Statements—(Continued)
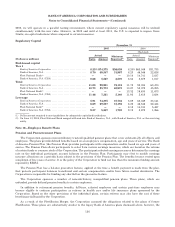
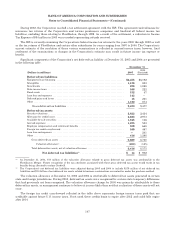
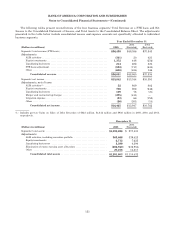
Amounts recognized in the Consolidated Financial Statements at December 31, 2005 and 2004 were as follows:
Qualified Pension
Plans Nonqualified
Pension Plans Postretirement
Health and Life Plans
(Dollars in millions) 2005 2004 2005 2004 2005 2004
Prepaid benefit cost .................................... $4,237 $3,384 $— $— $— $—
Accrued benefit cost .................................... ——(897) (918) (981) (822)
Additional minimum liability ............................ ——(187) (161) ——
Intangible asset ....................................... ———1——
AccumulatedOCI ...................................... ——187 160 ——
Net amount recognized at December 31 ........... $4,237 $3,384 $(897) $(918) $(981) $(822)
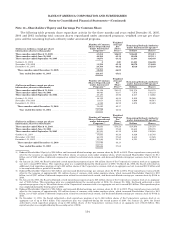
Net periodic pension benefit cost for 2005, 2004 and 2003 included the following components:
Qualified Pension Plans Nonqualified Pension Plans
(Dollars in millions) 2005 2004 2003 2005 2004 2003
Components of net periodic pension benefit cost
Servicecost .............................................. $ 261 $ 257 $ 187 $11 $27 $25
Interestcost.............................................. 643 623 514 61 62 45
Expected return on plan assets ............................. (983) (915) (735) ———
Amortizationofpriorservicecost ........................... 44 55 55 (8) 33
Recognized net actuarial loss ............................... 182 92 47 24 14 11
Recognized loss due to settlements and curtailments ........... ——— 9——
Net periodic pension benefit cost .................... $ 147 $ 112 $ 68 $97 $ 106 $ 84
Weighted average assumptions used to determine
net cost for years ended December 31
Discount rate(1) ........................................... 5.75% 6.25% 6.75% 5.75% 6.25% 6.75%
Expected return on plan assets ............................. 8.50 8.50 8.50 n/a n/a n/a
Rate of compensation increase .............................. 4.00 4.00 4.00 4.00 4.00 4.00
(1) In connection with the FleetBoston Merger, the plans of former FleetBoston were remeasured on April 1, 2004, using a discount
rate of 6.00 percent.
n/a = not applicable
For 2005, 2004 and 2003, net periodic postretirement benefit cost included the following components:
(Dollars in millions) 2005 2004(1) 2003
Components of net periodic postretirement benefit cost
Servicecost ............................................................................ $11 $9$9
Interestcost ........................................................................... 78 76 68
Expected return on plan assets ........................................................... (14) (16) (15)
Amortization of transition obligation ...................................................... 31 32 32
Amortizationofpriorservicecost ......................................................... —14
Recognized net actuarial loss ............................................................. 80 74 89
Net periodic postretirement benefit cost ........................................... $ 186 $ 176 $ 187
Weighted average assumptions used to determine net cost for years ended
December 31
Discount rate(2) ......................................................................... 5.75% 6.25% 6.75%
Expected return on plan assets ........................................................... 8.50 8.50 8.50
(1) Includes the effect of the adoption of FSP No. 106-2, which reduced net periodic postretirement benefit cost by $15 million.
(2) In connection with the FleetBoston Merger, the plans of former FleetBoston were remeasured on April 1, 2004, using a discount
rate of 6.00 percent.
141