Bank of America 2005 Annual Report Download - page 58
Download and view the complete annual report
Please find page 58 of the 2005 Bank of America annual report below. You can navigate through the pages in the report by either clicking on the pages listed below, or by using the keyword search tool below to find specific information within the annual report.-
 1
1 -
2
-
3
-
4
-
5
-
6
-
7
-
8
-
9
-
10
-
11
-
12
-
13
-
14
-
15
-
16
-
17
-
18
-
19
-
20
-
21
-
22
-
23
-
24
-
25
-
26
-
27
-
28
-
29
-
30
-
31
-
32
-
33
-
34
-
35
-
36
-
37
-
38
-
39
-
40
-
41
-
42
-
43
-
44
-
45
-
46
-
47
-
 48
48 -
 49
49 -
 50
50 -
 51
51 -
 52
52 -
 53
53 -
 54
54 -
 55
55 -
 56
56 -
 57
57 -
 58
58 -
 59
59 -
 60
60 -
 61
61 -
 62
62 -
 63
63 -
 64
64 -
 65
65 -
 66
66 -
 67
67 -
 68
68 -
69
-
70
-
71
-
72
-
73
-
74
-
75
-
76
-
77
-
78
-
79
-
80
-
81
-
82
-
83
-
84
-
85
-
86
-
87
-
88
-
89
-
90
-
91
-
92
-
93
-
94
-
95
-
96
-
97
-
98
-
99
-
100
-
101
-
102
-
103
-
104
-
105
-
106
-
107
-
108
-
109
-
110
-
111
-
112
-
113
-
114
-
115
-
116
-
117
-
118
-
119
-
120
-
121
-
122
-
123
-
124
-
125
-
126
-
127
-
128
-
129
-
130
-
131
-
132
-
133
-
134
-
135
-
136
-
137
-
138
-
139
-
140
-
141
-
142
-
143
-
144
-
145
-
146
-
147
-
148
-
149
-
150
-
151
-
152
-
153
-
154
-
155
-
156
-
157
-
158
-
159
-
160
-
161
-
162
-
163
-
164
-
165
-
166
-
167
-
168
-
169
-
170
-
171
-
172
-
173
-
174
-
175
-
176
-
177
-
178
-
179
-
180
-
181
-
182
-
183
-
184
-
185
-
186
-
187
-
188
-
189
-
190
-
191
-
192
-
193
-
194
-
195
-
196
-
197
-
198
-
199
-
200
-
201
-
202
-
203
-
204
-
205
-
206
-
207
-
208
-
209
-
210
-
211
-
212
-
213
 |
 |
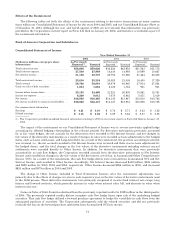
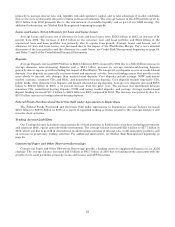
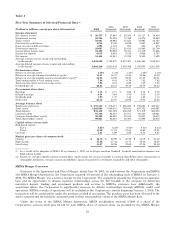
primarily to manage interest rate risk, liquidity risk and regulatory capital, and to take advantage of market conditions
that create more economically attractive returns on these investments. The average balance in the AFS portfolio grew by
$70.0 billion from 2004 primarily due to the reinvestment of available liquidity and as part of our ALM strategy. For
additional information, see Market Risk Management beginning on page 66.
Loans and Leases, Net of Allowance for Loan and Lease Losses
Average Loans and Leases, net of allowance for loan and lease losses, were $528.8 billion in 2005, an increase of 14
percent from 2004. The increase of $40.0 billion in the consumer loan and lease portfolio and $24.6 billion in the
commercial loan and lease portfolio was primarily due to organic loan growth. Average Loans and Leases, net of
allowance for loan and lease losses, also increased due to the impact of the FleetBoston Merger. For a more detailed
discussion of the loan portfolio and the allowance for credit losses, see Credit Risk Management beginning on page 49,
and Notes 7 and 8 of the Consolidated Financial Statements.
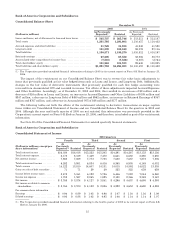
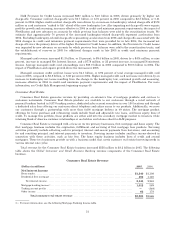
Deposits
Average Deposits increased $80.9 billion to $632.4 billion in 2005 compared to 2004 due to a $46.3 billion increase in
average domestic interest-bearing deposits and a $24.1 billion increase in average noninterest-bearing deposits
primarily due to organic growth including the impact of FleetBoston. We categorize our deposits as core or market-based
deposits. Core deposits are generally customer-based and represent a stable, low-cost funding source that usually reacts
more slowly to interest rate changes than market-based deposits. Core deposits include savings, NOW and money
market accounts, consumer CDs and IRAs, and noninterest-bearing deposits. Core deposits exclude negotiable CDs,
public funds, other domestic time deposits and foreign interest-bearing deposits. Average core deposits increased $69.5
billion to $563.6 billion in 2005, a 14 percent increase from the prior year. The increase was distributed between
consumer CDs, noninterest-bearing deposits, NOW and money market deposits, and savings. Average market-based
deposit funding increased $11.4 billion to $68.8 billion in 2005 compared to 2004. The increase was primarily due to a
$10.5 billion increase in foreign interest-bearing deposits.
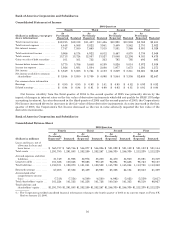
Federal Funds Purchased and Securities Sold under Agreements to Repurchase
The Federal Funds Purchased and Securities Sold under Agreements to Repurchase average balance increased
$65.5 billion to $230.8 billion in 2005 as a result of expanded trading activities related to the strategic initiative and
investor client activities.
Trading Account Liabilities
Our Trading Account Liabilities consist primarily of short positions in fixed income securities (including government
and corporate debt), equity and convertible instruments. The average balance increased $22.4 billion to $57.7 billion in
2005, which was due to growth in client-driven market-making activities in interest rate, credit and equity products, and
an increase in proprietary trading activities. For additional information, see Market Risk Management beginning on
page 66.
Commercial Paper and Other Short-term Borrowings
Commercial Paper and Other Short-term Borrowings provide a funding source to supplement Deposits in our ALM
strategy. The average balance increased $33.3 billion to $95.7 billion in 2005 due to funding needs associated with the
growth of core asset portfolios, primarily Loans and Leases, and AFS Securities.
22