Bank of America 2005 Annual Report Download - page 116
Download and view the complete annual report
Please find page 116 of the 2005 Bank of America annual report below. You can navigate through the pages in the report by either clicking on the pages listed below, or by using the keyword search tool below to find specific information within the annual report.-
 1
1 -
2
-
3
-
4
-
5
-
6
-
7
-
8
-
9
-
10
-
11
-
12
-
13
-
14
-
15
-
16
-
17
-
18
-
19
-
20
-
21
-
22
-
23
-
24
-
25
-
26
-
27
-
28
-
29
-
30
-
31
-
32
-
33
-
34
-
35
-
36
-
37
-
38
-
39
-
40
-
41
-
42
-
43
-
44
-
45
-
46
-
47
-
48
-
49
-
50
-
51
-
52
-
53
-
54
-
55
-
56
-
57
-
58
-
59
-
60
-
61
-
62
-
63
-
64
-
65
-
66
-
67
-
68
-
69
-
70
-
71
-
72
-
73
-
74
-
75
-
76
-
77
-
78
-
79
-
80
-
81
-
82
-
83
-
84
-
85
-
86
-
87
-
88
-
89
-
90
-
91
-
92
-
93
-
94
-
95
-
96
-
97
-
98
-
99
-
100
-
101
-
102
-
103
-
104
-
105
-
 106
106 -
 107
107 -
 108
108 -
 109
109 -
 110
110 -
 111
111 -
 112
112 -
 113
113 -
 114
114 -
 115
115 -
 116
116 -
 117
117 -
 118
118 -
 119
119 -
 120
120 -
 121
121 -
 122
122 -
 123
123 -
 124
124 -
 125
125 -
 126
126 -
127
-
128
-
129
-
130
-
131
-
132
-
133
-
134
-
135
-
136
-
137
-
138
-
139
-
140
-
141
-
142
-
143
-
144
-
145
-
146
-
147
-
148
-
149
-
150
-
151
-
152
-
153
-
154
-
155
-
156
-
157
-
158
-
159
-
160
-
161
-
162
-
163
-
164
-
165
-
166
-
167
-
168
-
169
-
170
-
171
-
172
-
173
-
174
-
175
-
176
-
177
-
178
-
179
-
180
-
181
-
182
-
183
-
184
-
185
-
186
-
187
-
188
-
189
-
190
-
191
-
192
-
193
-
194
-
195
-
196
-
197
-
198
-
199
-
200
-
201
-
202
-
203
-
204
-
205
-
206
-
207
-
208
-
209
-
210
-
211
-
212
-
213
 |
 |

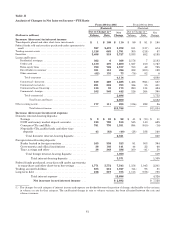
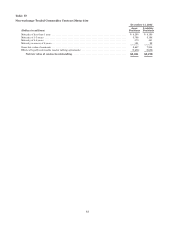
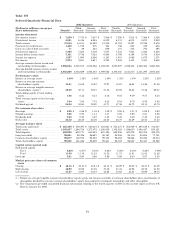
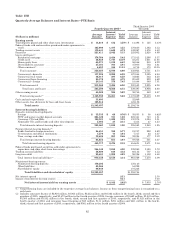
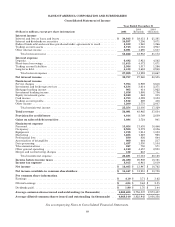
Table I
Average Balances and Interest Rates—FTE Basis
2005 2004
(Restated) 2003
(Restated)
(Dollars in millions) Average
Balance
Interest
Income/
Expense Yield/
Rate Average
Balance
Interest
Income/
Expense Yield/
Rate Average
Balance
Interest
Income/
Expense Yield/
Rate
Earning assets
Time deposits placed and other short-term investments ........... $ 14,286 $ 472 3.30% $ 14,254 $ 362 2.54% $ 9,056 $ 172 1.90%
Federal funds sold and securities purchased under agreements to
resell .................................................... 169,132 5,012 2.96 128,981 1,940 1.50 78,857 1,266 1.61
Trading account assets ....................................... 133,502 5,883 4.41 104,616 4,092 3.91 97,222 4,005 4.12
Securities .................................................. 219,843 11,047 5.03 150,171 7,320 4.88 70,644 3,135 4.44
Loans and leases(1):
Residential mortgage ....................................... 173,773 9,424 5.42 167,270 9,056 5.42 127,131 6,873 5.41
Creditcard ............................................... 53,997 6,253 11.58 43,435 4,653 10.71 28,210 2,886 10.23
Homeequitylines ......................................... 56,289 3,412 6.06 39,400 1,835 4.66 22,890 1,040 4.55
Direct/Indirect consumer ................................... 44,981 2,589 5.75 38,078 2,093 5.50 32,593 1,964 6.03
Other consumer(2) .......................................... 6,908 667 9.67 7,717 594 7.70 8,865 588 6.63
Total consumer .......................................... 335,948 22,345 6.65 295,900 18,231 6.16 219,689 13,351 6.08
Commercial—domestic ..................................... 128,034 8,266 6.46 114,644 6,978 6.09 93,458 6,441 6.89
Commercial real estate ..................................... 34,304 2,046 5.97 28,085 1,263 4.50 20,042 862 4.30
Commercial lease financing ................................. 20,441 992 4.85 17,483 819 4.68 10,061 395 3.92
Commercial—foreign ....................................... 18,491 1,292 6.99 16,505 850 5.15 12,970 460 3.55
Total commercial ........................................ 201,270 12,596 6.26 176,717 9,910 5.61 136,531 8,158 5.98
Total loans and leases .................................. 537,218 34,941 6.50 472,617 28,141 5.95 356,220 21,509 6.04
Otherearningassets ......................................... 38,013 2,103 5.53 34,634 1,815 5.24 37,599 1,729 4.60
Total earning assets(3) .................................... 1,111,994 59,458 5.35 905,273 43,670 4.82 649,598 31,816 4.90
Cash and cash equivalents .................................... 33,199 28,511 22,637
Otherassets,lessallowanceforloanandleaselosses ............. 124,699 110,847 76,869
Total assets ........................................ $1,269,892 $1,044,631 $749,104
Interest-bearing liabilities
Domestic interest-bearing deposits:
Savings .................................................. $ 36,602 $ 211 0.58% $ 33,959 $ 119 0.35% $ 24,538 $ 108 0.44%
NOW and money market deposit accounts .................... 227,722 2,839 1.25 214,542 1,921 0.90 148,896 1,236 0.83
ConsumerCDsandIRAs ................................... 124,385 4,091 3.29 94,770 2,540 2.68 70,246 2,556 3.64
Negotiable CDs, public funds and other time deposits ........... 6,865 250 3.65 5,977 290 4.85 7,627 130 1.70
Total domestic interest-bearing deposits .................... 395,574 7,391 1.87 349,248 4,870 1.39 251,307 4,030 1.60
Foreign interest-bearing deposits(4):
Banks located in foreign countries ........................... 22,945 1,202 5.24 18,426 679 3.68 13,959 285 2.04
Governments and official institutions ......................... 7,418 238 3.21 5,327 97 1.82 2,218 31 1.40
Time,savingsandother .................................... 31,603 661 2.09 27,739 275 0.99 19,027 216 1.14
Total foreign interest-bearing deposits ...................... 61,966 2,101 3.39 51,492 1,051 2.04 35,204 532 1.51
Total interest-bearing deposits ........................... 457,540 9,492 2.08 400,740 5,921 1.48 286,511 4,562 1.59
Federal funds purchased, securities sold under agreements to
repurchase and other short-term borrowings .................. 326,408 11,615 3.56 227,565 4,072 1.79 140,458 1,871 1.33
Trading account liabilities .................................... 57,689 2,364 4.10 35,326 1,317 3.73 37,176 1,286 3.46
Long-term debt .............................................. 97,709 4,418 4.52 92,303 3,683 3.99 67,077 2,948 4.40
Total interest-bearing liabilities(3) .......................... 939,346 27,889 2.97 755,934 14,993 1.98 531,222 10,667 2.01
Noninterest-bearing sources:
Noninterest-bearing deposits ................................ 174,892 150,819 119,722
Other liabilities ........................................... 55,793 53,063 48,069
Shareholders’ equity ....................................... 99,861 84,815 50,091
Total liabilities and shareholders’ equity ............ $1,269,892 $1,044,631 $749,104
Netinterestspread .......................................... 2.38 2.84 2.89
Impact of noninterest-bearing sources .......................... 0.46 0.33 0.37
Net interest income/yield on earning assets ......... $31,569 2.84% $28,677 3.17% $21,149 3.26%
(1) Nonperforming loans are included in the respective average loan balances. Income on these nonperforming loans is recognized on a cash basis.
(2) Includes consumer finance of $3,137 million, $3,735 million and $4,137 million in 2005, 2004 and 2003, respectively; foreign consumer of $3,565
million, $3,020 million and $1,977 million in 2005, 2004 and 2003, respectively; and consumer lease financing of $206 million, $962 million and $2,751
million in 2005, 2004 and 2003, respectively.
(3) Interest income includes the impact of interest rate risk management contracts, which increased interest income on the underlying assets $704
million, $2,130 million and $2,581 million in 2005, 2004 and 2003, respectively. Interest expense includes the impact of interest rate risk management
contracts, which increased interest expense on the underlying liabilities $1,335 million, $1,452 million and $873 million in 2005, 2004 and 2003,
respectively. For further information on interest rate contracts, see “Interest Rate Risk Management” beginning on page 69.
(4) Primarily consists of time deposits in denominations of $100,000 or more.
80