Bank of America 2005 Annual Report Download - page 91
Download and view the complete annual report
Please find page 91 of the 2005 Bank of America annual report below. You can navigate through the pages in the report by either clicking on the pages listed below, or by using the keyword search tool below to find specific information within the annual report.-
 1
1 -
2
-
3
-
4
-
5
-
6
-
7
-
8
-
9
-
10
-
11
-
12
-
13
-
14
-
15
-
16
-
17
-
18
-
19
-
20
-
21
-
22
-
23
-
24
-
25
-
26
-
27
-
28
-
29
-
30
-
31
-
32
-
33
-
34
-
35
-
36
-
37
-
38
-
39
-
40
-
41
-
42
-
43
-
44
-
45
-
46
-
47
-
48
-
49
-
50
-
51
-
52
-
53
-
54
-
55
-
56
-
57
-
58
-
59
-
60
-
61
-
62
-
63
-
64
-
65
-
66
-
67
-
68
-
69
-
70
-
71
-
72
-
73
-
74
-
75
-
76
-
77
-
78
-
79
-
80
-
 81
81 -
 82
82 -
 83
83 -
 84
84 -
 85
85 -
 86
86 -
 87
87 -
 88
88 -
 89
89 -
 90
90 -
 91
91 -
 92
92 -
 93
93 -
 94
94 -
 95
95 -
 96
96 -
 97
97 -
 98
98 -
 99
99 -
 100
100 -
 101
101 -
102
-
103
-
104
-
105
-
106
-
107
-
108
-
109
-
110
-
111
-
112
-
113
-
114
-
115
-
116
-
117
-
118
-
119
-
120
-
121
-
122
-
123
-
124
-
125
-
126
-
127
-
128
-
129
-
130
-
131
-
132
-
133
-
134
-
135
-
136
-
137
-
138
-
139
-
140
-
141
-
142
-
143
-
144
-
145
-
146
-
147
-
148
-
149
-
150
-
151
-
152
-
153
-
154
-
155
-
156
-
157
-
158
-
159
-
160
-
161
-
162
-
163
-
164
-
165
-
166
-
167
-
168
-
169
-
170
-
171
-
172
-
173
-
174
-
175
-
176
-
177
-
178
-
179
-
180
-
181
-
182
-
183
-
184
-
185
-
186
-
187
-
188
-
189
-
190
-
191
-
192
-
193
-
194
-
195
-
196
-
197
-
198
-
199
-
200
-
201
-
202
-
203
-
204
-
205
-
206
-
207
-
208
-
209
-
210
-
211
-
212
-
213
 |
 |

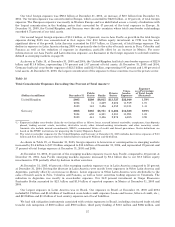
Table 14 shows the maturity profile of the net credit default protection portfolio at December 31, 2005 and 2004.
Table 14
Net Credit Default Protection by Maturity Profile
December 31
2005 2004
Less than or equal to one year .................................................................... —% 3%
Greater than one year and less than or equal to five years ............................................ 65 87
Greater than five years .......................................................................... 35 10
Total ...................................................................................... 100% 100%
Table 15 shows our net credit default protection portfolio by credit exposure debt rating at December 31, 2005 and
2004.
Table 15
Net Credit Default Protection by Credit Exposure Debt Rating
(Dollars in millions) December 31
2005 2004
Ratings Net Notional Percent Net Notional Percent
AAA .......................................................... $22 0.2%$89 0.8%
AA ........................................................... 523 3.6 340 3.1
A............................................................. 4,861 33.1 2,884 26.6
BBB .......................................................... 8,572 58.2 5,777 53.3
BB ........................................................... 1,792 12.2 1,233 11.4
B............................................................. 424 2.9 250 2.3
CCCandbelow ................................................ 149 1.0 15 0.1
NR(1) ......................................................... (1,650) (11.2) 260 2.4
Total ..................................................... $14,693 100.0% $10,848 100.0%
(1) In addition to unrated names, “NR” includes $1,677 million in net CDS index positions. While index positions are principally
investment grade, CDS indices include names in and across each of the ratings categories.
55