Bank of America 2005 Annual Report Download - page 86
Download and view the complete annual report
Please find page 86 of the 2005 Bank of America annual report below. You can navigate through the pages in the report by either clicking on the pages listed below, or by using the keyword search tool below to find specific information within the annual report.-
 1
1 -
2
-
3
-
4
-
5
-
6
-
7
-
8
-
9
-
10
-
11
-
12
-
13
-
14
-
15
-
16
-
17
-
18
-
19
-
20
-
21
-
22
-
23
-
24
-
25
-
26
-
27
-
28
-
29
-
30
-
31
-
32
-
33
-
34
-
35
-
36
-
37
-
38
-
39
-
40
-
41
-
42
-
43
-
44
-
45
-
46
-
47
-
48
-
49
-
50
-
51
-
52
-
53
-
54
-
55
-
56
-
57
-
58
-
59
-
60
-
61
-
62
-
63
-
64
-
65
-
66
-
67
-
68
-
69
-
70
-
71
-
72
-
73
-
74
-
75
-
 76
76 -
 77
77 -
 78
78 -
 79
79 -
 80
80 -
 81
81 -
 82
82 -
 83
83 -
 84
84 -
 85
85 -
 86
86 -
 87
87 -
 88
88 -
 89
89 -
 90
90 -
 91
91 -
 92
92 -
 93
93 -
 94
94 -
 95
95 -
 96
96 -
97
-
98
-
99
-
100
-
101
-
102
-
103
-
104
-
105
-
106
-
107
-
108
-
109
-
110
-
111
-
112
-
113
-
114
-
115
-
116
-
117
-
118
-
119
-
120
-
121
-
122
-
123
-
124
-
125
-
126
-
127
-
128
-
129
-
130
-
131
-
132
-
133
-
134
-
135
-
136
-
137
-
138
-
139
-
140
-
141
-
142
-
143
-
144
-
145
-
146
-
147
-
148
-
149
-
150
-
151
-
152
-
153
-
154
-
155
-
156
-
157
-
158
-
159
-
160
-
161
-
162
-
163
-
164
-
165
-
166
-
167
-
168
-
169
-
170
-
171
-
172
-
173
-
174
-
175
-
176
-
177
-
178
-
179
-
180
-
181
-
182
-
183
-
184
-
185
-
186
-
187
-
188
-
189
-
190
-
191
-
192
-
193
-
194
-
195
-
196
-
197
-
198
-
199
-
200
-
201
-
202
-
203
-
204
-
205
-
206
-
207
-
208
-
209
-
210
-
211
-
212
-
213
 |
 |

We manage credit risk based on the risk profile of the borrower or counterparty, repayment sources, the nature of
underlying collateral, and other support given current events, conditions and expectations. We classify our Loans and
Leases as either consumer or commercial and monitor their credit risk separately as discussed below.
Consumer Portfolio Credit Risk Management
Credit risk management for the consumer portfolio begins with initial underwriting and continues throughout a
borrower’s credit cycle. Statistical techniques are used to establish product pricing, risk appetite, operating processes
and metrics to balance risks and returns. Consumer exposure is grouped by product and other attributes for purposes of
evaluating credit risk. Statistical models are built using detailed behavioral information from external sources such as
credit bureaus as well as internal historical experience. These models are essential to our consumer credit risk
management process and are used in the determination of credit decisions, collections management strategies, portfolio
management decisions, determination of the allowance for consumer loan and lease losses, and economic capital
allocations for credit risk.
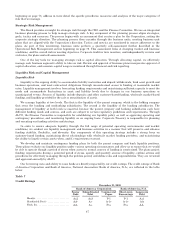
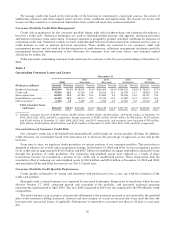
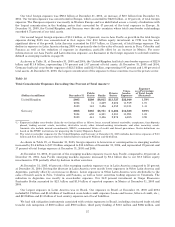
Table 8 presents outstanding consumer loans and leases for each year in the five-year period ending at December 31,
2005.
Table 8
Outstanding Consumer Loans and Leases
December 31
2005 2004
(Restated) 2003
(Restated) 2002
(Restated) 2001
(Restated)
(Dollars in millions) Amount Percent Amount Percent Amount Percent Amount Percent Amount Percent
Residential mortgage ......... $182,596 51.3% $178,079 54.3% $140,483 58.5% $108,332 54.8% $ 78,203 47.3%
Creditcard .................. 58,548 16.5 51,726 15.8 34,814 14.5 24,729 12.5 19,884 12.0
Homeequitylines ............ 62,098 17.5 50,126 15.3 23,859 9.9 23,236 11.8 22,107 13.4
Direct/Indirect consumer ...... 45,490 12.8 40,513 12.3 33,415 13.9 31,068 15.7 30,317 18.4
Other consumer(1) ............ 6,725 1.9 7,439 2.3 7,558 3.2 10,355 5.2 14,744 8.9
Total consumer loans
and leases ............ $355,457 100.0% $327,883 100.0% $240,129 100.0% $197,720 100.0% $165,255 100.0%
(1) Includes consumer finance of $2,849 million, $3,395 million, $3,905 million, $4,438 million, and $5,331 million at December 31,
2005, 2004, 2003, 2002, and 2001, respectively; foreign consumer of $3,841 million, $3,563 million, $1,969 million, $1,970 million,
and $2,092 million at December 31, 2005, 2004, 2003, 2002, and 2001, respectively; and consumer lease financing of $35 million,
$481 million, $1,684 million, $3,947 million, and $7,321 million at December 31, 2005, 2004, 2003, 2002, and 2001, respectively.
Concentrations of Consumer Credit Risk
Our consumer credit risk is diversified both geographically and through our various product offerings. In addition,
credit decisions are statistically based with tolerances set to decrease the percentage of approvals as the risk profile
increases.
From time to time, we purchase credit protection on certain portions of our consumer portfolio. This protection is
designed to enhance our overall risk management strategy. At December 31, 2005 and 2004, we have mitigated a portion
of our credit risk on approximately $110.4 billion and $88.7 billion of residential mortgage and indirect automobile loans
through the purchase of credit protection. Our regulatory risk-weighted assets were reduced as a result of these
transactions because we transferred a portion of our credit risk to unaffiliated parties. These transactions had the
cumulative effect of reducing our risk-weighted assets by $30.6 billion and $25.5 billion at December 31, 2005 and 2004,
and resulted in 28 bp and 26 bp increases in our Tier 1 Capital ratio.
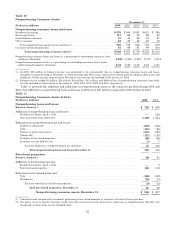
Consumer Portfolio Credit Quality Performance
Credit quality continued to be strong and consistent with performance from a year ago with the exception of the
credit card portfolio.
Managed credit card performance was impacted by increased bankruptcy filings prior to legislation which became
effective October 17, 2005, continued growth and seasoning of the portfolio, and increased minimum payment
requirements implemented in April 2004. The year 2005 compared to 2004 was also impacted by the FleetBoston credit
card portfolio.
The entire balance of an account is contractually delinquent if the minimum payment is not received by the specified
date on the customer’s billing statement. Interest and fees continue to accrue on our past due loans until the date the
loan goes into nonaccrual status, if applicable. Delinquency is reported on accruing loans that are 30 days or more past
due.
50