Bank of America 2005 Annual Report Download - page 93
Download and view the complete annual report
Please find page 93 of the 2005 Bank of America annual report below. You can navigate through the pages in the report by either clicking on the pages listed below, or by using the keyword search tool below to find specific information within the annual report.-
 1
1 -
2
-
3
-
4
-
5
-
6
-
7
-
8
-
9
-
10
-
11
-
12
-
13
-
14
-
15
-
16
-
17
-
18
-
19
-
20
-
21
-
22
-
23
-
24
-
25
-
26
-
27
-
28
-
29
-
30
-
31
-
32
-
33
-
34
-
35
-
36
-
37
-
38
-
39
-
40
-
41
-
42
-
43
-
44
-
45
-
46
-
47
-
48
-
49
-
50
-
51
-
52
-
53
-
54
-
55
-
56
-
57
-
58
-
59
-
60
-
61
-
62
-
63
-
64
-
65
-
66
-
67
-
68
-
69
-
70
-
71
-
72
-
73
-
74
-
75
-
76
-
77
-
78
-
79
-
80
-
81
-
82
-
 83
83 -
 84
84 -
 85
85 -
 86
86 -
 87
87 -
 88
88 -
 89
89 -
 90
90 -
 91
91 -
 92
92 -
 93
93 -
 94
94 -
 95
95 -
 96
96 -
 97
97 -
 98
98 -
 99
99 -
 100
100 -
 101
101 -
 102
102 -
 103
103 -
104
-
105
-
106
-
107
-
108
-
109
-
110
-
111
-
112
-
113
-
114
-
115
-
116
-
117
-
118
-
119
-
120
-
121
-
122
-
123
-
124
-
125
-
126
-
127
-
128
-
129
-
130
-
131
-
132
-
133
-
134
-
135
-
136
-
137
-
138
-
139
-
140
-
141
-
142
-
143
-
144
-
145
-
146
-
147
-
148
-
149
-
150
-
151
-
152
-
153
-
154
-
155
-
156
-
157
-
158
-
159
-
160
-
161
-
162
-
163
-
164
-
165
-
166
-
167
-
168
-
169
-
170
-
171
-
172
-
173
-
174
-
175
-
176
-
177
-
178
-
179
-
180
-
181
-
182
-
183
-
184
-
185
-
186
-
187
-
188
-
189
-
190
-
191
-
192
-
193
-
194
-
195
-
196
-
197
-
198
-
199
-
200
-
201
-
202
-
203
-
204
-
205
-
206
-
207
-
208
-
209
-
210
-
211
-
212
-
213
 |
 |

Our total foreign exposure was $92.2 billion at December 31, 2005, an increase of $2.0 billion from December 31,
2004. Our foreign exposure was concentrated in Europe, which accounted for $62.0 billion, or 67 percent, of total foreign
exposure. The European exposure was mostly in Western Europe and was distributed across a variety of industries with
the largest concentration in the banking sector that accounted for 47 percent of the total exposure in Europe. At
December 31, 2005, the United Kingdom and Germany were the only countries whose total cross-border outstandings
exceeded 0.75 percent of our total assets.
Our second largest foreign exposure of $14.1 billion, or 15 percent, was in Asia Pacific as growth in the total foreign
exposure during 2005 was concentrated in that region. Our $3.0 billion equity investment in CCB was the most
significant driver of the growth. Latin America accounted for $10.7 billion, or 12 percent, of total foreign exposure. The
decline in exposure in Latin America during 2005 was primarily due to the sales of branch assets in Peru, Colombia and
Panama as well as the reduction of exposure in Argentina, partially offset by an increase in Mexico. For more
information on our Asia Pacific and Latin America exposure, see discussion in the foreign exposure to selected countries
defined as emerging markets on page 58.
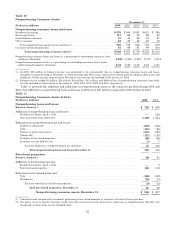
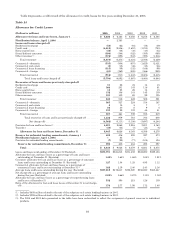
As shown in Table 18, at December 31, 2005 and 2004, the United Kingdom had total cross-border exposure of $22.9
billion and $11.9 billion, representing 1.78 percent and 1.07 percent of total assets. At December 31, 2005 and 2004,
Germany had total cross-border exposure of $12.5 billion and $12.0 billion, representing 0.97 percent and 1.08 percent of
total assets. At December 31, 2005, the largest concentration of the exposure to these countries was in the private sector.
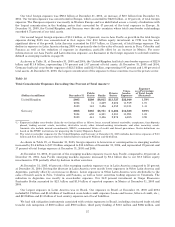
Table 18
Total Cross-border Exposure Exceeding One Percent of Total Assets(1,2)
(Dollars in millions) December 31 Public
Sector Banks Private
Sector
Cross-
border
Exposure
Exposure
as a Percentage
of Total Assets
(Restated)
United Kingdom 2005 $298 $8,915 $13,727 $22,940 1.78%
2004 74 3,239 8,606 11,919 1.07
2003 143 3,426 6,552 10,121 1.41
Germany 2005 $285 $5,751 $ 6,484 $12,520 0.97%
2004 659 6,251 5,081 11,991 1.08
2003 441 3,436 2,978 6,855 0.95
(1) Exposure includes cross-border claims by our foreign offices as follows: loans, accrued interest receivable, acceptances, time deposits
placed, trading account assets, securities, derivative assets, other interest-earning investments and other monetary assets.
Amounts also include unused commitments, SBLCs, commercial letters of credit and formal guarantees. Sector definitions are
based on the FFIEC instructions for preparing the Country Exposure Report.
(2) The total cross-border exposure for the United Kingdom and Germany at December 31, 2005 includes derivatives exposure of $2.3
billion and $3.4 billion, against which we hold collateral totaling $1.9 billion and $2.6 billion.
As shown in Table 19, at December 31, 2005, foreign exposure to borrowers or counterparties in emerging markets
increased by $1.6 billion to $17.2 billion compared to $15.6 billion at December 31, 2004, and represented 19 percent and
17 percent of total foreign exposure at December 31, 2005 and 2004.
At December 31, 2005, 51 percent of the emerging markets exposure was in Asia Pacific, compared to 40 percent at
December 31, 2004. Asia Pacific emerging markets exposure increased by $2.4 billion due to our $3.0 billion equity
investment in CCB partially offset by declines in other countries.
At December 31, 2005, 48 percent of the emerging markets exposure was in Latin America compared to 58 percent
at December 31, 2004. Driving the decrease in Latin America were mostly lower exposures in Other Latin America and
Argentina, partially offset by an increase in Mexico. Lower exposures in Other Latin America were attributable to the
sales of branch assets in Peru, Colombia and Panama, as well as lower securities trading exposure in Venezuela. The
reduction in Argentina was mostly in cross-border exposure. Our 24.9 percent investment in Grupo Financiero
Santander Serfin accounted for $2.1 billion and $1.9 billion of reported exposure in Mexico at December 31, 2005 and
2004.
Our largest exposure in Latin America was in Brazil. Our exposure in Brazil at December 31, 2005 and 2004
included $1.2 billion and $1.6 billion of traditional cross-border credit exposure (Loans and Leases, letters of credit, etc.),
and $2.2 billion and $1.8 billion of local country exposure net of local liabilities.
We had risk mitigation instruments associated with certain exposures in Brazil, including structured trade related
transfer risk mitigation of $830 million and $950 million, third party funding of $313 million and $286 million, and
57