Bank of America 2005 Annual Report Download - page 182
Download and view the complete annual report
Please find page 182 of the 2005 Bank of America annual report below. You can navigate through the pages in the report by either clicking on the pages listed below, or by using the keyword search tool below to find specific information within the annual report.-
 1
1 -
2
-
3
-
4
-
5
-
6
-
7
-
8
-
9
-
10
-
11
-
12
-
13
-
14
-
15
-
16
-
17
-
18
-
19
-
20
-
21
-
22
-
23
-
24
-
25
-
26
-
27
-
28
-
29
-
30
-
31
-
32
-
33
-
34
-
35
-
36
-
37
-
38
-
39
-
40
-
41
-
42
-
43
-
44
-
45
-
46
-
47
-
48
-
49
-
50
-
51
-
52
-
53
-
54
-
55
-
56
-
57
-
58
-
59
-
60
-
61
-
62
-
63
-
64
-
65
-
66
-
67
-
68
-
69
-
70
-
71
-
72
-
73
-
74
-
75
-
76
-
77
-
78
-
79
-
80
-
81
-
82
-
83
-
84
-
85
-
86
-
87
-
88
-
89
-
90
-
91
-
92
-
93
-
94
-
95
-
96
-
97
-
98
-
99
-
100
-
101
-
102
-
103
-
104
-
105
-
106
-
107
-
108
-
109
-
110
-
111
-
112
-
113
-
114
-
115
-
116
-
117
-
118
-
119
-
120
-
121
-
122
-
123
-
124
-
125
-
126
-
127
-
128
-
129
-
130
-
131
-
132
-
133
-
134
-
135
-
136
-
137
-
138
-
139
-
140
-
141
-
142
-
143
-
144
-
145
-
146
-
147
-
148
-
149
-
150
-
151
-
152
-
153
-
154
-
155
-
156
-
157
-
158
-
159
-
160
-
161
-
162
-
163
-
164
-
165
-
166
-
167
-
168
-
169
-
170
-
171
-
 172
172 -
 173
173 -
 174
174 -
 175
175 -
 176
176 -
 177
177 -
 178
178 -
 179
179 -
 180
180 -
 181
181 -
 182
182 -
 183
183 -
 184
184 -
 185
185 -
 186
186 -
 187
187 -
 188
188 -
 189
189 -
 190
190 -
 191
191 -
 192
192 -
193
-
194
-
195
-
196
-
197
-
198
-
199
-
200
-
201
-
202
-
203
-
204
-
205
-
206
-
207
-
208
-
209
-
210
-
211
-
212
-
213
 |
 |

BANK OF AMERICA CORPORATION AND SUBSIDIARIES
Notes to Consolidated Financial Statements—(Continued)
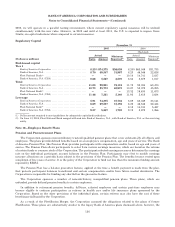
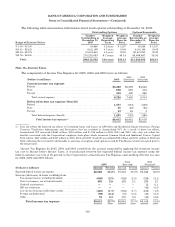
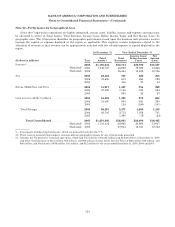
The following table summarizes information about stock options outstanding at December 31, 2005:
Outstanding Options Options Exercisable
Range of Exercise Prices
Number
Outstanding at
December 31,
2005
Weighted
Average
Remaining
Term
Weighted
Average
Exercise
Price
Number
Exercisable at
December 31,
2005
Weighted
Average
Exercise
Price
$ 5.00 – $15.00 ....................................... 60,888 0.2years $ 12.87 60,888 $ 12.87
$15.01 – $23.25 ....................................... 6,181,199 4.7 years 19.09 6,181,199 19.09
$23.26 – $32.75 ....................................... 121,675,632 4.2 years 28.93 121,674,932 28.93
$32.76 – $49.50 ....................................... 170,215,083 6.7 years 40.14 85,409,467 38.34
Total ............................................ 298,132,802 5.6 years $35.13 213,326,486 $32.41
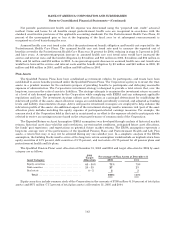
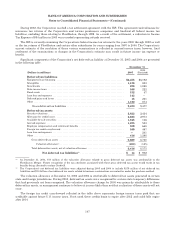
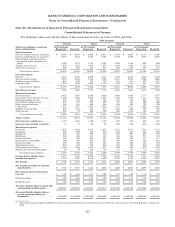
Note 18—Income Taxes
The components of Income Tax Expense for 2005, 2004 and 2003 were as follows:
(Dollars in millions) 2005 2004
(Restated) 2003
(Restated)
Current income tax expense
Federal .............................................................. $5,229 $6,392 $4,642
State ................................................................ 676 683 412
Foreign.............................................................. 415 405 260
Total current expense ............................................. 6,320 7,480 5,314
Deferred income tax expense (benefit)
Federal .............................................................. 1,577 (512) (249)
State ................................................................ 85 (23) (50)
Foreign.............................................................. 33 16 4
Total deferred expense (benefit) ..................................... 1,695 (519) (295)
Total income tax expense(1) .................................. $8,015 $6,961 $5,019
(1) Does not reflect the deferred tax effects of Unrealized Gains and Losses on AFS Debt and Marketable Equity Securities, Foreign
Currency Translation Adjustments and Derivatives that are included in Accumulated OCI. As a result of these tax effects,
Accumulated OCI increased $2,863 million, $303 million and $1,916 million in 2005, 2004 and 2003. Also, does not reflect tax
benefits associated with the Corporation’s employee stock plans which increased Common Stock and Additional Paid-in Capital
$416 million, $401 million and $443 million in 2005, 2004 and 2003. Goodwill was reduced $22 million and $101 million in 2005 and
2004, reflecting the tax benefits attributable to exercises of employee stock options issued by FleetBoston which had vested prior to
the merger date.
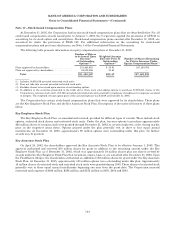
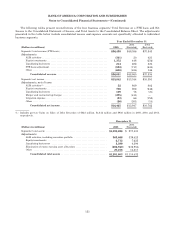
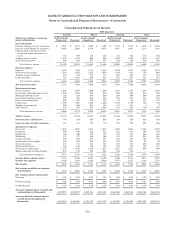
Income Tax Expense for 2005, 2004 and 2003 varied from the amount computed by applying the statutory income
tax rate to Income before Income Taxes. A reconciliation between the expected federal income tax expense using the
federal statutory tax rate of 35 percent to the Corporation’s actual Income Tax Expense and resulting effective tax rate
for 2005, 2004 and 2003 follows:
2005 2004
(Restated) 2003
(Restated)
(Dollars in millions) Amount Percent Amount Percent Amount Percent
Expected federal income tax expense ............................. $8,568 35.0% $7,318 35.0% $5,523 35.0%
Increase (decrease) in taxes resulting from:
Tax-exempt income, including dividends ....................... (605) (2.5) (526) (2.5) (325) (2.1)
State tax expense, net of federal benefit ....................... 495 2.0 429 2.1 235 1.5
Goodwill amortization ...................................... —— — — 12 0.1
IRS tax settlement ......................................... —— — — (84) (0.5)
Low income housing credits/other credits ...................... (423) (1.7) (352) (1.7) (212) (1.3)
Foreign tax differential ..................................... (99) (0.4) (78) (0.4) (50) (0.3)
Other ..................................................... 79 0.3 170 0.8 (80) (0.6)
Total income tax expense ...................... $8,015 32.7% $6,961 33.3% $5,019 31.8%
146