Bank of America 2005 Annual Report Download - page 118
Download and view the complete annual report
Please find page 118 of the 2005 Bank of America annual report below. You can navigate through the pages in the report by either clicking on the pages listed below, or by using the keyword search tool below to find specific information within the annual report.-
 1
1 -
2
-
3
-
4
-
5
-
6
-
7
-
8
-
9
-
10
-
11
-
12
-
13
-
14
-
15
-
16
-
17
-
18
-
19
-
20
-
21
-
22
-
23
-
24
-
25
-
26
-
27
-
28
-
29
-
30
-
31
-
32
-
33
-
34
-
35
-
36
-
37
-
38
-
39
-
40
-
41
-
42
-
43
-
44
-
45
-
46
-
47
-
48
-
49
-
50
-
51
-
52
-
53
-
54
-
55
-
56
-
57
-
58
-
59
-
60
-
61
-
62
-
63
-
64
-
65
-
66
-
67
-
68
-
69
-
70
-
71
-
72
-
73
-
74
-
75
-
76
-
77
-
78
-
79
-
80
-
81
-
82
-
83
-
84
-
85
-
86
-
87
-
88
-
89
-
90
-
91
-
92
-
93
-
94
-
95
-
96
-
97
-
98
-
99
-
100
-
101
-
102
-
103
-
104
-
105
-
106
-
107
-
 108
108 -
 109
109 -
 110
110 -
 111
111 -
 112
112 -
 113
113 -
 114
114 -
 115
115 -
 116
116 -
 117
117 -
 118
118 -
 119
119 -
 120
120 -
 121
121 -
 122
122 -
 123
123 -
 124
124 -
 125
125 -
 126
126 -
 127
127 -
 128
128 -
129
-
130
-
131
-
132
-
133
-
134
-
135
-
136
-
137
-
138
-
139
-
140
-
141
-
142
-
143
-
144
-
145
-
146
-
147
-
148
-
149
-
150
-
151
-
152
-
153
-
154
-
155
-
156
-
157
-
158
-
159
-
160
-
161
-
162
-
163
-
164
-
165
-
166
-
167
-
168
-
169
-
170
-
171
-
172
-
173
-
174
-
175
-
176
-
177
-
178
-
179
-
180
-
181
-
182
-
183
-
184
-
185
-
186
-
187
-
188
-
189
-
190
-
191
-
192
-
193
-
194
-
195
-
196
-
197
-
198
-
199
-
200
-
201
-
202
-
203
-
204
-
205
-
206
-
207
-
208
-
209
-
210
-
211
-
212
-
213
 |
 |

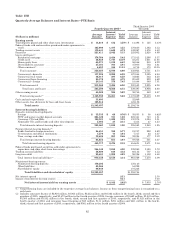
Table III
Selected Loan Maturity Data(1)
December 31, 2005
(Dollars in millions)
Due in
One Year
or Less
Due After
One Year
Through
Five Years Due After
Five Years Total
Commercial—domestic .................................................... $52,186 $ 56,557 $ 31,790 $140,533
Commercial real estate—domestic .......................................... 13,830 17,976 3,375 35,181
Foreign(2) ................................................................ 20,801 4,518 437 25,756
Total selected loans ................................................. $86,817 $ 79,051 $ 35,602 $201,470
Percentoftotal .......................................................... 43.1% 39.2% 17.7% 100.0%
Sensitivity of loans to changes in interest rates for loans due after one
year:
Fixedinterestrates ................................................... $ 8,927 $ 14,737
Floatingoradjustableinterestrates .................................... 70,124 20,865
Total ........................................................... $79,051 $35,602
(1) Loan maturities are based on the remaining maturities under contractual terms.
(2) Loan maturities include other consumer, commercial—foreign and commercial real estate loans.
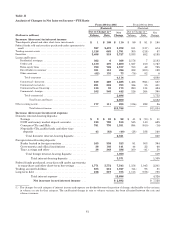
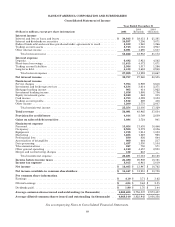
Table IV
Short-term Borrowings
2005 2004 2003
(Restated) (Restated)
(Dollars in millions) Amount Rate Amount Rate Amount Rate
Federal funds purchased
AtDecember31 ................................................... $ 2,715 4.06% $ 3,108 2.23% $ 2,356 0.92%
Average during year ............................................... 3,670 3.09 3,724 1.31 5,736 1.10
Maximum month-end balance during year ............................ 5,964 — 7,852 — 7,877 —
Securities sold under agreements to repurchase
AtDecember31 ................................................... 237,940 4.26 116,633 2.23 75,690 1.12
Average during year ............................................... 227,081 3.62 161,494 1.86 102,074 1.15
Maximum month-end balance during year ............................ 273,544 — 191,899 — 124,746 —
Commercial paper
AtDecember31 ................................................... 24,968 4.21 25,379 2.09 7,605 1.09
Average during year ............................................... 26,335 3.22 21,178 1.45 2,976 1.29
Maximum month-end balance during year ............................ 31,380 — 26,486 — 9,136 —
Other short-term borrowings
AtDecember31 ................................................... 91,301 4.58 53,219 2.48 27,375 1.98
Average during year ............................................... 69,322 3.51 41,169 1.73 29,672 2.02
Maximum month-end balance during year ............................ 91,301 — 53,756 — 46,635 —
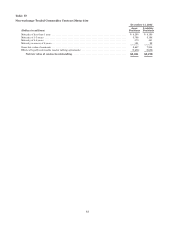
Table V
Non-exchange Traded Commodity Contracts
(Dollars in millions) Asset
Positions Liability
Positions
Net fair value of contracts outstanding, January 1, 2005 ............................................... $ 2,195 $ 1,452
Effects of legally enforceable master netting agreements ............................................... 4,449 4,449
Gross fair value of contracts outstanding, January 1, 2005 ............................................. 6,644 5,901
Contracts realized or otherwise settled .............................................................. (1,990) (1,947)
Fairvalueofnewcontracts ........................................................................ 1,763 1,887
Other changes in fair value ........................................................................ 2,240 2,074
Gross fair value of contracts outstanding, December 31, 2005 ........................................... 8,657 7,915
Effects of legally enforceable master netting agreements ............................................... (5,636) (5,636)
Net fair value of contracts outstanding, December 31, 2005 ........................ $3,021 $2,279
82