Bank of America 2005 Annual Report Download - page 155
Download and view the complete annual report
Please find page 155 of the 2005 Bank of America annual report below. You can navigate through the pages in the report by either clicking on the pages listed below, or by using the keyword search tool below to find specific information within the annual report.-
 1
1 -
2
-
3
-
4
-
5
-
6
-
7
-
8
-
9
-
10
-
11
-
12
-
13
-
14
-
15
-
16
-
17
-
18
-
19
-
20
-
21
-
22
-
23
-
24
-
25
-
26
-
27
-
28
-
29
-
30
-
31
-
32
-
33
-
34
-
35
-
36
-
37
-
38
-
39
-
40
-
41
-
42
-
43
-
44
-
45
-
46
-
47
-
48
-
49
-
50
-
51
-
52
-
53
-
54
-
55
-
56
-
57
-
58
-
59
-
60
-
61
-
62
-
63
-
64
-
65
-
66
-
67
-
68
-
69
-
70
-
71
-
72
-
73
-
74
-
75
-
76
-
77
-
78
-
79
-
80
-
81
-
82
-
83
-
84
-
85
-
86
-
87
-
88
-
89
-
90
-
91
-
92
-
93
-
94
-
95
-
96
-
97
-
98
-
99
-
100
-
101
-
102
-
103
-
104
-
105
-
106
-
107
-
108
-
109
-
110
-
111
-
112
-
113
-
114
-
115
-
116
-
117
-
118
-
119
-
120
-
121
-
122
-
123
-
124
-
125
-
126
-
127
-
128
-
129
-
130
-
131
-
132
-
133
-
134
-
135
-
136
-
137
-
138
-
139
-
140
-
141
-
142
-
143
-
144
-
 145
145 -
 146
146 -
 147
147 -
 148
148 -
 149
149 -
 150
150 -
 151
151 -
 152
152 -
 153
153 -
 154
154 -
 155
155 -
 156
156 -
 157
157 -
 158
158 -
 159
159 -
 160
160 -
 161
161 -
 162
162 -
 163
163 -
 164
164 -
 165
165 -
166
-
167
-
168
-
169
-
170
-
171
-
172
-
173
-
174
-
175
-
176
-
177
-
178
-
179
-
180
-
181
-
182
-
183
-
184
-
185
-
186
-
187
-
188
-
189
-
190
-
191
-
192
-
193
-
194
-
195
-
196
-
197
-
198
-
199
-
200
-
201
-
202
-
203
-
204
-
205
-
206
-
207
-
208
-
209
-
210
-
211
-
212
-
213
 |
 |

BANK OF AMERICA CORPORATION AND SUBSIDIARIES
Notes to Consolidated Financial Statements—(Continued)
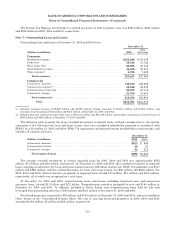
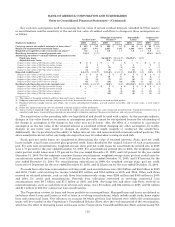
Interest Income and charge-offs, with a corresponding reduction in Noninterest Income. Portfolio balances, delinquency
and historical loss amounts of the managed loans and leases portfolio for 2005 and 2004 were as follows:
December 31, 2005 December 31, 2004 (Restated)
(Dollars in millions)
Total
Principal
Amount of
Loans and
Leases
Principal
Amount
of Accruing
Loans and
Leases
Past Due
90 Days or
More(1)
Principal
Amount of
Nonperforming
Loans and
Leases
Total
Principal
Amount of
Loans and
Leases
Principal
Amount
of Accruing
Loans and
Leases
Past Due
90 Days or
More(1)
Principal
Amount of
Nonperforming
Loans and
Leases
Residential mortgage ................. $182,596 $ — $ 570 $178,079 $ — $ 554
Creditcard .......................... 60,785 1,217 — 58,629 1,223 —
Homeequitylines .................... 62,553 3 117 50,756 3 66
Direct/Indirect consumer .............. 45,490 75 37 40,513 58 33
Other consumer ...................... 6,725 15 61 7,439 23 85
Total consumer .................... 358,149 1,310 785 335,416 1,307 738
Commercial—domestic ............... 142,437 117 581 125,432 121 855
Commercial real estate ............... 35,766 4 49 32,319 1 87
Commercial lease financing ........... 20,705 15 62 21,115 14 266
Commercial—foreign ................. 21,330 32 34 18,401 2 267
Total commercial ................... 220,238 168 726 197,267 138 1,475
Total managed loans and
leases ........................ 578,387 $1,478 $1,511 532,683 $1,445 $2,213
Loans in revolving securitizations ...... (4,596) (10,870)
Total held loans and leases ... $573,791 $521,813
Year Ended December 31, 2005 Year Ended December 31, 2004 (Restated)
(Dollars in millions)
Average
Loans and
Leases
Outstanding
Loans and
Leases Net
Losses Net Loss
Ratio(2)
Average
Loans and
Leases
Outstanding
Loans and
Leases Net
Losses Net Loss
Ratio(2)
Residential mortgage ................. $173,773 $ 27 0.02% $167,270 $ 36 0.02%
Creditcard .......................... 59,048 4,086 6.92 50,296 2,829 5.62
Homeequitylines .................... 56,842 31 0.05 39,942 15 0.04
Direct/Indirect consumer .............. 44,981 248 0.55 38,078 208 0.55
Other consumer ...................... 6,908 275 3.98 7,717 193 2.50
Total consumer .................... 341,552 4,667 1.37 303,303 3,281 1.08
Commercial—domestic ............... 130,870 157 0.12 117,422 184 0.16
Commercial real estate ............... 34,304 — — 28,085 (3) (0.01)
Commercial lease financing ........... 20,441 231 1.13 17,483 9 0.05
Commercial—foreign ................. 18,491 (72) (0.39) 16,505 173 1.05
Total commercial ................... 204,106 316 0.16 179,495 363 0.20
Total managed loans and
leases ........................ 545,658 $4,983 0.91% 482,798 $3,644 0.75%
Loans in revolving securitizations ...... (8,440) (10,181)
Total held loans and
leases .................... $537,218 $472,617
(1) Excludes consumer real estate loans, which are placed on nonperforming status at 90 days past due.
(2) The net loss ratio is calculated by dividing managed loans and leases net losses by average managed loans and leases outstanding
for each loan and lease category.
119