Bank of America 2005 Annual Report Download - page 61
Download and view the complete annual report
Please find page 61 of the 2005 Bank of America annual report below. You can navigate through the pages in the report by either clicking on the pages listed below, or by using the keyword search tool below to find specific information within the annual report.-
 1
1 -
2
-
3
-
4
-
5
-
6
-
7
-
8
-
9
-
10
-
11
-
12
-
13
-
14
-
15
-
16
-
17
-
18
-
19
-
20
-
21
-
22
-
23
-
24
-
25
-
26
-
27
-
28
-
29
-
30
-
31
-
32
-
33
-
34
-
35
-
36
-
37
-
38
-
39
-
40
-
41
-
42
-
43
-
44
-
45
-
46
-
47
-
48
-
49
-
50
-
 51
51 -
 52
52 -
 53
53 -
 54
54 -
 55
55 -
 56
56 -
 57
57 -
 58
58 -
 59
59 -
 60
60 -
 61
61 -
 62
62 -
 63
63 -
 64
64 -
 65
65 -
 66
66 -
 67
67 -
 68
68 -
 69
69 -
 70
70 -
 71
71 -
72
-
73
-
74
-
75
-
76
-
77
-
78
-
79
-
80
-
81
-
82
-
83
-
84
-
85
-
86
-
87
-
88
-
89
-
90
-
91
-
92
-
93
-
94
-
95
-
96
-
97
-
98
-
99
-
100
-
101
-
102
-
103
-
104
-
105
-
106
-
107
-
108
-
109
-
110
-
111
-
112
-
113
-
114
-
115
-
116
-
117
-
118
-
119
-
120
-
121
-
122
-
123
-
124
-
125
-
126
-
127
-
128
-
129
-
130
-
131
-
132
-
133
-
134
-
135
-
136
-
137
-
138
-
139
-
140
-
141
-
142
-
143
-
144
-
145
-
146
-
147
-
148
-
149
-
150
-
151
-
152
-
153
-
154
-
155
-
156
-
157
-
158
-
159
-
160
-
161
-
162
-
163
-
164
-
165
-
166
-
167
-
168
-
169
-
170
-
171
-
172
-
173
-
174
-
175
-
176
-
177
-
178
-
179
-
180
-
181
-
182
-
183
-
184
-
185
-
186
-
187
-
188
-
189
-
190
-
191
-
192
-
193
-
194
-
195
-
196
-
197
-
198
-
199
-
200
-
201
-
202
-
203
-
204
-
205
-
206
-
207
-
208
-
209
-
210
-
211
-
212
-
213
 |
 |

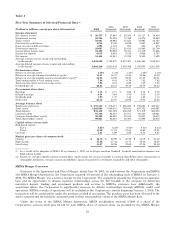
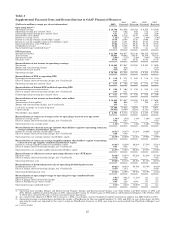
Table 3
Supplemental Financial Data and Reconciliations to GAAP Financial Measures
(Dollars in millions, except per share information) 2005 2004
(Restated) 2003
(Restated) 2002
(Restated) 2001
(Restated)
Operating basis(1,2)
Operatingearnings ...................................................................... $ 16,740 $14,358 $10,762 $ 9,553 $ 8,749
Operatingearningspercommonshare ..................................................... 4.17 3.82 3.62 3.14 2.74
Diluted operating earnings per common share ............................................... 4.11 3.75 3.55 3.05 2.69
Shareholder value added ................................................................. 6,594 5,718 5,475 4,030 3,794
Return on average assets ................................................................. 1.32% 1.37% 1.44% 1.46% 1.36%
Return on average common shareholders’ equity ............................................. 16.79 16.96 21.50 19.96 17.99
Return on average tangible common shareholders’ equity ..................................... 34.57 33.51 29.20 27.53 27.02
Operating efficiency ratio (FTE basis) ...................................................... 49.66 53.13 52.38 51.84 53.74
Dividend payout ratio .................................................................... 45.84 44.98 39.76 38.79 41.48
Operating leverage (combined basis)(3) ...................................................... 8.33 0.44 (6.06) n/a n/a
FTE basis data
Netinterestincome ...................................................................... $ 31,569 $28,677 $21,149 $20,705 $20,247
Total revenue ........................................................................... 56,923 49,682 38,478 35,579 36,110
Netinterestyield ........................................................................ 2.84% 3.17% 3.26% 3.63% 3.61%
Efficiency ratio .......................................................................... 50.38 54.37 52.38 51.84 57.35
Reconciliation of net income to operating earnings
Netincome ............................................................................. $ 16,465 $13,947 $10,762 $ 9,553 $ 7,499
Merger and restructuring charges ......................................................... 412 618 — — 1,700
Related income tax benefit ................................................................ (137) (207) — — (450)
Operatingearnings ...................................................................... $ 16,740 $14,358 $10,762 $ 9,553 $ 8,749
Reconciliation of EPS to operating EPS
Earnings per common share .............................................................. $4.10$ 3.71 $ 3.62 $ 3.14 $ 2.35
Effect of merger and restructuring charges, net of tax benefit .................................. 0.07 0.11 — — 0.39
Operatingearningspercommonshare ..................................................... $4.17$ 3.82 $ 3.62 $ 3.14 $ 2.74
Reconciliation of diluted EPS to diluted operating EPS
Diluted earnings per common share ........................................................ $4.04$ 3.64 $ 3.55 $ 3.05 $ 2.30
Effect of merger and restructuring charges, net of tax benefit .................................. 0.07 0.11 — — 0.39
Diluted operating earnings per common share ............................................... $4.11$ 3.75 $ 3.55 $ 3.05 $ 2.69
Reconciliation of net income to shareholder value added
Netincome ............................................................................. $ 16,465 $13,947 $10,762 $ 9,553 $ 7,499
Amortization of intangibles(2) ............................................................. 809 664 217 218 878
Merger and restructuring charges, net of tax benefit ......................................... 275 411 — — 1,250
Cash basis earnings on an operating basis .................................................. 17,549 15,022 10,979 9,771 9,627
Capitalcharge .......................................................................... (10,955) (9,304) (5,504) (5,741) (5,833)
Shareholder value added ................................................................. $ 6,594 $ 5,718 $ 5,475 $ 4,030 $ 3,794
Reconciliation of return on average assets to operating return on average assets
Return on average assets ................................................................. 1.30% 1.34% 1.44% 1.46% 1.16%
Effect of merger and restructuring charges, net of tax benefit .................................. 0.02 0.03 — — 0.20
Operating return on average assets ........................................................ 1.32% 1.37% 1.44% 1.46% 1.36%
Reconciliation of return on average common shareholders’ equity to operating return on
average common shareholders’ equity
Return on average common shareholders’ equity ............................................. 16.51% 16.47% 21.50% 19.96% 15.42%
Effect of merger and restructuring charges, net of tax benefit .................................. 0.28 0.49 — — 2.57
Operating return on average common shareholders’ equity .................................... 16.79% 16.96% 21.50% 19.96% 17.99%
Reconciliation of return on average tangible common shareholders’ equity to operating
return on average tangible common shareholders’ equity
Return on average tangible common shareholders’ equity ..................................... 34.03% 32.59% 29.20% 27.53% 23.51%
Effect of merger and restructuring charges, net of tax benefit .................................. 0.54 0.92 — — 3.51
Operating return on average tangible common shareholders’ equity ............................ 34.57% 33.51% 29.20% 27.53% 27.02%
Reconciliation of efficiency ratio to operating efficiency ratio (FTE basis)
Efficiency ratio .......................................................................... 50.38% 54.37% 52.38% 51.84% 57.35%
Effect of merger and restructuring charges, net of tax benefit .................................. (0.72) (1.24) — — (3.61)
Operating efficiency ratio ................................................................. 49.66% 53.13% 52.38% 51.84% 53.74%
Reconciliation of dividend payout ratio to operating dividend payout ratio
Dividend payout ratio .................................................................... 46.61% 46.31% 39.76% 38.79% 48.40%
Effect of merger and restructuring charges, net of tax benefit .................................. (0.77) (1.33) — — (6.92)
Operating dividend payout ratio ........................................................... 45.84% 44.98% 39.76% 38.79% 41.48%
Reconciliation of operating leverage to operating leverage (combined basis)
Operating leverage ...................................................................... 8.41% (4.91)% (1.12)% n/a n/a
Effect of merger and restructuring charges .................................................. (0.93) 3.07 — n/a n/a
EffectofFleetBostonproformaresults ..................................................... 0.85 2.28 (4.94) n/a n/a
Operating leverage (combined basis)(3) ...................................................... 8.33% 0.44% (6.06)% n/a n/a
(1) Operating basis excludes Merger and Restructuring Charges. Merger and Restructuring Charges were $412 million and $618 million in 2005 and
2004. Merger and Restructuring Charges in 2001 represented Provision for Credit Losses of $395 million and Noninterest Expense of $1.3 billion, both
of which were related to the exit of certain consumer finance businesses.
(2) As a result of the adoption of SFAS 142 on January 1, 2002, we no longer amortize Goodwill. Goodwill amortization expense was $662 million in 2001.
(3) Operating leverage (combined basis) includes the results of FleetBoston for the year ended December 31, 2004 and 2003 on a pro forma basis. In 2004,
operating leverage was impacted by the costs to integrate FleetBoston; however, in 2005, operating leverage benefited from FleetBoston Merger’s cost
savings.
n/a = not available
25