Bank of America 2005 Annual Report Download - page 75
Download and view the complete annual report
Please find page 75 of the 2005 Bank of America annual report below. You can navigate through the pages in the report by either clicking on the pages listed below, or by using the keyword search tool below to find specific information within the annual report.-
 1
1 -
2
-
3
-
4
-
5
-
6
-
7
-
8
-
9
-
10
-
11
-
12
-
13
-
14
-
15
-
16
-
17
-
18
-
19
-
20
-
21
-
22
-
23
-
24
-
25
-
26
-
27
-
28
-
29
-
30
-
31
-
32
-
33
-
34
-
35
-
36
-
37
-
38
-
39
-
40
-
41
-
42
-
43
-
44
-
45
-
46
-
47
-
48
-
49
-
50
-
51
-
52
-
53
-
54
-
55
-
56
-
57
-
58
-
59
-
60
-
61
-
62
-
63
-
64
-
 65
65 -
 66
66 -
 67
67 -
 68
68 -
 69
69 -
 70
70 -
 71
71 -
 72
72 -
 73
73 -
 74
74 -
 75
75 -
 76
76 -
 77
77 -
 78
78 -
 79
79 -
 80
80 -
 81
81 -
 82
82 -
 83
83 -
 84
84 -
 85
85 -
86
-
87
-
88
-
89
-
90
-
91
-
92
-
93
-
94
-
95
-
96
-
97
-
98
-
99
-
100
-
101
-
102
-
103
-
104
-
105
-
106
-
107
-
108
-
109
-
110
-
111
-
112
-
113
-
114
-
115
-
116
-
117
-
118
-
119
-
120
-
121
-
122
-
123
-
124
-
125
-
126
-
127
-
128
-
129
-
130
-
131
-
132
-
133
-
134
-
135
-
136
-
137
-
138
-
139
-
140
-
141
-
142
-
143
-
144
-
145
-
146
-
147
-
148
-
149
-
150
-
151
-
152
-
153
-
154
-
155
-
156
-
157
-
158
-
159
-
160
-
161
-
162
-
163
-
164
-
165
-
166
-
167
-
168
-
169
-
170
-
171
-
172
-
173
-
174
-
175
-
176
-
177
-
178
-
179
-
180
-
181
-
182
-
183
-
184
-
185
-
186
-
187
-
188
-
189
-
190
-
191
-
192
-
193
-
194
-
195
-
196
-
197
-
198
-
199
-
200
-
201
-
202
-
203
-
204
-
205
-
206
-
207
-
208
-
209
-
210
-
211
-
212
-
213
 |
 |

PB&I includes Banc of America Investments (BAI), our full-service retail brokerage business and our Premier
Banking channel. PB&I brings personalized banking and investment expertise through priority service with client-
dedicated teams. PB&I provides a high-touch client experience through a network of more than 2,100 client managers to
our affluent customers with a personal wealth profile that includes investable assets plus a mortgage that exceeds
$250,000 or they have at least $100,000 of investable assets. BAI is the third largest bank-owned brokerage company in
the U.S. with $151 billion in client assets. BAI serves approximately 1.6 million accounts through a network of
approximately 1,895 financial advisors throughout the U.S.
The Private Bank provides integrated wealth management solutions to high-net-worth individuals, middle market
institutions and charitable organizations with investable assets greater than $3 million. Services include investment,
trust, banking and lending services as well as specialty asset management services (oil and gas, real estate, farm and
ranch, timberland, private businesses and tax advisory).
FWA at the Private Bank is designed to serve the needs of ultra high-net-worth individuals and families. This new
business provides a higher level of contact and tailored service and wealth management solutions that address the
complex needs of clients with investable assets greater than $50 million. FWA was rolled out during the first quarter of
2005.
Columbia is an asset management organization primarily serving the needs of institutional customers. Columbia
provides asset management services, liquidity strategies and separate accounts. Columbia also provides mutual funds
offering a full range of investment styles across an array of products including equities, fixed income (taxable and
nontaxable) and cash products (taxable and nontaxable). In addition to servicing institutional clients, Columbia
distributes its products and services to individuals through The Private Bank, PB&I, FWA and nonproprietary channels
including other brokerage firms.
Other Services include the Investment Services Group, which provides products and services from traditional capital
markets products to alternative investments and Banc of America Specialist, a New York Stock Exchange market-
maker.
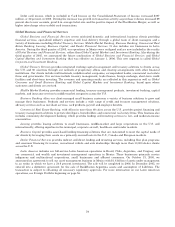
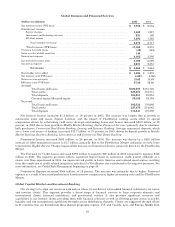
Global Wealth and Investment Management
(Dollars in millions) 2005 2004
Net interest income (FTE basis) ......................................... $ 3,770 $ 2,869
Noninterest income:
Investment and brokerage services .................................. 3,122 2,728
Allotherincome .................................................. 501 336
Total noninterest income ....................................... 3,623 3,064
Total revenue (FTE basis) .......................................... 7,393 5,933
Provision for credit losses .............................................. (5) (20)
Noninterest expense ................................................... 3,672 3,431
Income before income taxes ............................................ 3,726 2,522
Income tax expense ................................................... 1,338 917
Net income .................................................. $ 2,388 $ 1,605
Shareholder value added ............................................... $ 1,337 $ 754
Net interest yield (FTE basis) ........................................... 3.21% 3.36%
Returnonaverageequity .............................................. 23.34 19.35
Efficiency ratio (FTE basis) ............................................. 49.66 57.83
Average:
Totalloansandleases.......................................... $ 54,021 $ 44,057
Totalassets .................................................. 125,289 91,889
Total deposits ................................................. 115,301 83,053
Common equity/Allocated equity ................................ 10,232 8,296
Year end:
Totalloansandleases.......................................... 58,277 49,783
Totalassets .................................................. 127,156 122,587
Total deposits ................................................. 113,389 111,107
Net Interest Income increased $901 million, or 31 percent, in 2005. This increase was due to growth in deposits and
loans in PB&I and The Private Bank. Average Deposits increased $32.2 billion, or 39 percent, in 2005 primarily due to
the migration of $28.1 billion of account balances from Global Consumer and Small Business Banking to PB&I, and
organic growth in PB&I and The Private Bank. Average Loans and Leases increased $10.0 billion, or 23 percent, due to
higher loan volume in PB&I and The Private Bank. The secondary driver of the increase in Average Deposits, and Loans
and Leases was the impact of the FleetBoston portfolio.
39