Bank of America 2005 Annual Report Download - page 149
Download and view the complete annual report
Please find page 149 of the 2005 Bank of America annual report below. You can navigate through the pages in the report by either clicking on the pages listed below, or by using the keyword search tool below to find specific information within the annual report.-
 1
1 -
2
-
3
-
4
-
5
-
6
-
7
-
8
-
9
-
10
-
11
-
12
-
13
-
14
-
15
-
16
-
17
-
18
-
19
-
20
-
21
-
22
-
23
-
24
-
25
-
26
-
27
-
28
-
29
-
30
-
31
-
32
-
33
-
34
-
35
-
36
-
37
-
38
-
39
-
40
-
41
-
42
-
43
-
44
-
45
-
46
-
47
-
48
-
49
-
50
-
51
-
52
-
53
-
54
-
55
-
56
-
57
-
58
-
59
-
60
-
61
-
62
-
63
-
64
-
65
-
66
-
67
-
68
-
69
-
70
-
71
-
72
-
73
-
74
-
75
-
76
-
77
-
78
-
79
-
80
-
81
-
82
-
83
-
84
-
85
-
86
-
87
-
88
-
89
-
90
-
91
-
92
-
93
-
94
-
95
-
96
-
97
-
98
-
99
-
100
-
101
-
102
-
103
-
104
-
105
-
106
-
107
-
108
-
109
-
110
-
111
-
112
-
113
-
114
-
115
-
116
-
117
-
118
-
119
-
120
-
121
-
122
-
123
-
124
-
125
-
126
-
127
-
128
-
129
-
130
-
131
-
132
-
133
-
134
-
135
-
136
-
137
-
138
-
 139
139 -
 140
140 -
 141
141 -
 142
142 -
 143
143 -
 144
144 -
 145
145 -
 146
146 -
 147
147 -
 148
148 -
 149
149 -
 150
150 -
 151
151 -
 152
152 -
 153
153 -
 154
154 -
 155
155 -
 156
156 -
 157
157 -
 158
158 -
 159
159 -
160
-
161
-
162
-
163
-
164
-
165
-
166
-
167
-
168
-
169
-
170
-
171
-
172
-
173
-
174
-
175
-
176
-
177
-
178
-
179
-
180
-
181
-
182
-
183
-
184
-
185
-
186
-
187
-
188
-
189
-
190
-
191
-
192
-
193
-
194
-
195
-
196
-
197
-
198
-
199
-
200
-
201
-
202
-
203
-
204
-
205
-
206
-
207
-
208
-
209
-
210
-
211
-
212
-
213
 |
 |

BANK OF AMERICA CORPORATION AND SUBSIDIARIES
Notes to Consolidated Financial Statements—(Continued)
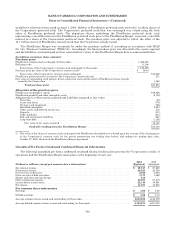
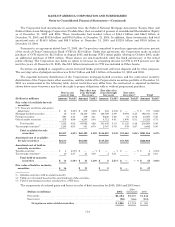
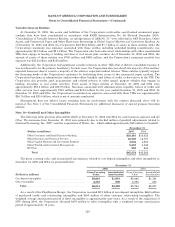
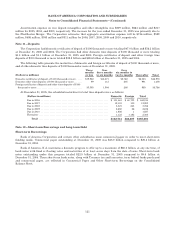
At December 31, 2005, accumulated net unrealized losses on AFS debt and marketable equity securities included in
Accumulated OCI were $3.0 billion, net of the related income tax benefit of $1.8 billion. At December 31, 2004,
accumulated net unrealized losses on these securities were $196 million, net of the related income tax benefit of $146
million.
The following table presents the current fair value and the associated unrealized losses only on investments in
securities with unrealized losses at December 31, 2005 and 2004. The table also discloses whether these securities have
had unrealized losses for less than twelve months, or for twelve months or longer.
December 31, 2005
Less than twelve months Twelve months or longer Total
(Dollars in millions) Fair
Value Unrealized
Losses Fair
Value Unrealized
Losses Fair
Value Unrealized
Losses
Available-for-sale securities
U.S. Treasury securities and agency debentures(1) ..... $ 251 $ (9) $ 163 $ (4) $ 414 $ (13)
Mortgage-backed securities ......................... 149,979 (3,766) 40,236 (1,502) 190,215 (5,268)
Foreign securities ................................. 3,455 (41) 852 (13) 4,307 (54)
Other taxable securities ............................ 3,882 (79) 469 (20) 4,351 (99)
Total taxable securities .......................... 157,567 (3,895) 41,720 (1,539) 199,287 (5,434)
Tax-exempt securities(1) ............................ 2,308 (27) 156 (5) 2,464 (32)
Total temporarily-impaired available-for-sale
securities ................................. 159,875 (3,922) 41,876 (1,544) 201,751 (5,466)
Temporarily-impaired marketable equity
securities ..................................... 146 (18) — — 146 (18)
Total temporarily-impaired securities ...... $160,021 $(3,940) $41,876 $(1,544) $201,897 $(5,484)
December 31, 2004
Less than twelve months Twelve months or longer Total
(Dollars in millions) Fair
Value Unrealized
Losses Fair
Value Unrealized
Losses Fair
Value Unrealized
Losses
Available-for-sale securities
U.S. Treasury securities and agency debentures(1) ..... $ 381 $ (1) $ 22 $ — $ 403 $ (1)
Mortgage-backed securities ......................... 52,687 (297) 17,426 (327) 70,113 (624)
Foreign securities ................................. 4,964 (11) 99 (15) 5,063 (26)
Other taxable securities ............................ 1,130 (9) 37 (4) 1,167 (13)
Total taxable securities .......................... 59,162 (318) 17,584 (346) 76,746 (664)
Tax-exempt securities(1) ............................ 1,088 (5) 21 — 1,109 (5)
Total temporarily-impaired available-for-sale
securities ................................. 60,250 (323) 17,605 (346) 77,855 (669)
Temporarily-impaired marketable equity
securities ..................................... 83 (2) — — 83 (2)
Held-to-maturity securities
Taxable securities ................................. 41 (4) — — 41 (4)
Tax-exempt securities ............................. 288 (1) — — 288 (1)
Total temporarily-impaired held-to-maturity
securities ................................. 329 (5) — — 329 (5)
Total temporarily-impaired securities ...... $ 60,662 $ (330) $ 17,605 $ (346) $ 78,267 $ (676)
(1) Unrealized losses less than $500 thousand are shown as zero.
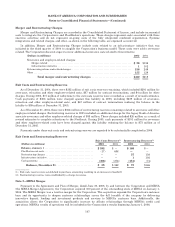
The unrealized losses associated with U.S. Treasury securities and agency debentures, mortgage-backed securities,
certain foreign securities, other taxable securities and tax-exempt securities are not considered to be other-than-
temporary because their unrealized losses are related to changes in interest rates and do not affect the expected cash
flows of the underlying collateral or issuer. The Corporation has the ability and intent to hold these securities for a
period of time sufficient to recover all unrealized losses. Accordingly, the Corporation has not recognized any other-than-
temporary impairments for these securities.
113