Bank of America 2005 Annual Report Download - page 187
Download and view the complete annual report
Please find page 187 of the 2005 Bank of America annual report below. You can navigate through the pages in the report by either clicking on the pages listed below, or by using the keyword search tool below to find specific information within the annual report.-
 1
1 -
2
-
3
-
4
-
5
-
6
-
7
-
8
-
9
-
10
-
11
-
12
-
13
-
14
-
15
-
16
-
17
-
18
-
19
-
20
-
21
-
22
-
23
-
24
-
25
-
26
-
27
-
28
-
29
-
30
-
31
-
32
-
33
-
34
-
35
-
36
-
37
-
38
-
39
-
40
-
41
-
42
-
43
-
44
-
45
-
46
-
47
-
48
-
49
-
50
-
51
-
52
-
53
-
54
-
55
-
56
-
57
-
58
-
59
-
60
-
61
-
62
-
63
-
64
-
65
-
66
-
67
-
68
-
69
-
70
-
71
-
72
-
73
-
74
-
75
-
76
-
77
-
78
-
79
-
80
-
81
-
82
-
83
-
84
-
85
-
86
-
87
-
88
-
89
-
90
-
91
-
92
-
93
-
94
-
95
-
96
-
97
-
98
-
99
-
100
-
101
-
102
-
103
-
104
-
105
-
106
-
107
-
108
-
109
-
110
-
111
-
112
-
113
-
114
-
115
-
116
-
117
-
118
-
119
-
120
-
121
-
122
-
123
-
124
-
125
-
126
-
127
-
128
-
129
-
130
-
131
-
132
-
133
-
134
-
135
-
136
-
137
-
138
-
139
-
140
-
141
-
142
-
143
-
144
-
145
-
146
-
147
-
148
-
149
-
150
-
151
-
152
-
153
-
154
-
155
-
156
-
157
-
158
-
159
-
160
-
161
-
162
-
163
-
164
-
165
-
166
-
167
-
168
-
169
-
170
-
171
-
172
-
173
-
174
-
175
-
176
-
 177
177 -
 178
178 -
 179
179 -
 180
180 -
 181
181 -
 182
182 -
 183
183 -
 184
184 -
 185
185 -
 186
186 -
 187
187 -
 188
188 -
 189
189 -
 190
190 -
 191
191 -
 192
192 -
 193
193 -
 194
194 -
 195
195 -
 196
196 -
 197
197 -
198
-
199
-
200
-
201
-
202
-
203
-
204
-
205
-
206
-
207
-
208
-
209
-
210
-
211
-
212
-
213
 |
 |

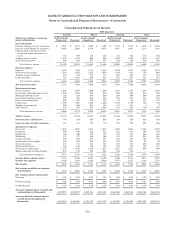
BANK OF AMERICA CORPORATION AND SUBSIDIARIES
Notes to Consolidated Financial Statements—(Continued)
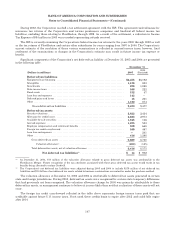
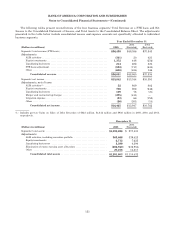
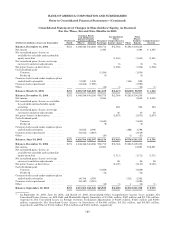
The following tables present reconciliations of the four business segments’ Total Revenue on a FTE basis and Net
Income to the Consolidated Statement of Income, and Total Assets to the Consolidated Balance Sheet. The adjustments
presented in the table below include consolidated income and expense amounts not specifically allocated to individual
business segments.
Year Ended December 31
(Dollars in millions) 2005 2004
(Restated) 2003
(Restated)
Segments’ total revenue (FTE basis) ....................................... $56,438 $49,386 $37,843
Adjustments:
ALM activities ...................................................... (501) 20 421
Equity investments .................................................. 1,372 448 (256)
Liquidating businesses ............................................... 214 282 324
FTE basis adjustment ............................................... (832) (717) (644)
Other .............................................................. (600) (454) 146
Consolidated revenue ......................................... $56,091 $48,965 $37,834
Segments’ net income .................................................... $15,842 $13,344 $10,391
Adjustments, net of taxes:
ALM activities(1) .................................................... 52 869 802
Equity investments .................................................. 796 202 (246)
Liquidating businesses ............................................... 109 78 (21)
Mergerandrestructuringcharges ..................................... (275) (411) —
Litigation expense ................................................... (33) 66 (150)
Other .............................................................. (26) (201) (14)
Consolidated net income ....................................... $16,465 $13,947 $10,762
(1) Includes pre-tax Gains on Sales of Debt Securities of $823 million, $1,612 million and $938 million in 2005, 2004 and 2003,
respectively.
December 31
(Dollars in millions) 2005 2004
(Restated)
Segments’ total assets ................................................... $1,096,286 $ 977,431
Adjustments:
ALM activities, including securities portfolio ........................... 365,068 339,423
Equity investments ................................................. 6,712 7,625
Liquidating businesses .............................................. 3,399 4,390
Elimination of excess earning asset allocations .......................... (206,940) (232,954)
Other ............................................................. 27,278 14,517
Consolidated total assets ...................................... $1,291,803 $1,110,432
151