Bank of America 2005 Annual Report Download - page 9
Download and view the complete annual report
Please find page 9 of the 2005 Bank of America annual report below. You can navigate through the pages in the report by either clicking on the pages listed below, or by using the keyword search tool below to find specific information within the annual report.-
 1
1 -
 2
2 -
 3
3 -
 4
4 -
 5
5 -
 6
6 -
 7
7 -
 8
8 -
 9
9 -
 10
10 -
 11
11 -
 12
12 -
 13
13 -
 14
14 -
 15
15 -
 16
16 -
 17
17 -
 18
18 -
 19
19 -
 20
20 -
21
-
22
-
23
-
24
-
25
-
26
-
27
-
28
-
29
-
30
-
31
-
32
-
33
-
34
-
35
-
36
-
37
-
38
-
39
-
40
-
41
-
42
-
43
-
44
-
45
-
46
-
47
-
48
-
49
-
50
-
51
-
52
-
53
-
54
-
55
-
56
-
57
-
58
-
59
-
60
-
61
-
62
-
63
-
64
-
65
-
66
-
67
-
68
-
69
-
70
-
71
-
72
-
73
-
74
-
75
-
76
-
77
-
78
-
79
-
80
-
81
-
82
-
83
-
84
-
85
-
86
-
87
-
88
-
89
-
90
-
91
-
92
-
93
-
94
-
95
-
96
-
97
-
98
-
99
-
100
-
101
-
102
-
103
-
104
-
105
-
106
-
107
-
108
-
109
-
110
-
111
-
112
-
113
-
114
-
115
-
116
-
117
-
118
-
119
-
120
-
121
-
122
-
123
-
124
-
125
-
126
-
127
-
128
-
129
-
130
-
131
-
132
-
133
-
134
-
135
-
136
-
137
-
138
-
139
-
140
-
141
-
142
-
143
-
144
-
145
-
146
-
147
-
148
-
149
-
150
-
151
-
152
-
153
-
154
-
155
-
156
-
157
-
158
-
159
-
160
-
161
-
162
-
163
-
164
-
165
-
166
-
167
-
168
-
169
-
170
-
171
-
172
-
173
-
174
-
175
-
176
-
177
-
178
-
179
-
180
-
181
-
182
-
183
-
184
-
185
-
186
-
187
-
188
-
189
-
190
-
191
-
192
-
193
-
194
-
195
-
196
-
197
-
198
-
199
-
200
-
201
-
202
-
203
-
204
-
205
-
206
-
207
-
208
-
209
-
210
-
211
-
212
-
213
 |
 |

8 Bank of America 2005
How We Grow: 2005 Financial Overview
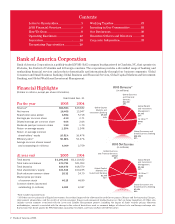
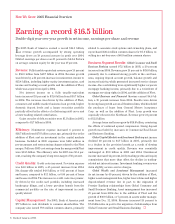
Earning a record $16.5 billion
Double-digit year-over-year growth in net income, earnings per share and revenue
In 2005 Bank of America earned a record $16.5 billion,
as revenue growth accompanied by strong operating
leverage drove an 18 percent increase in profit over 2004.
Diluted earnings per share rose 11 percent to $4.04. Return
on average common equity for the year was 17 percent.
Revenue: Fully taxable-equivalent revenue grew 15 percent
to $56.9 billion from $49.7 billion in 2004. Revenue growth
was driven by a 21 percent increase in noninterest income to
$25.4 billion, including higher equity investment gains, card
income and trading account profits and the addition of Fleet,
which was acquired on April 1, 2004.
Net interest income on a fully taxable-equivalent
basis increased 10 percent to $31.6 billion from $28.7 billion
in 2004. The increase was driven by the addition of Fleet,
consumer and middle market business loan growth, higher
domestic deposit levels and a larger securities portfolio
partially offset by the effects of a flattening yield curve and
a lower trading-related contribution.
Gains on sales of debt securities were $1.1 billion in 2005,
compared to $1.7 billion in 2004.
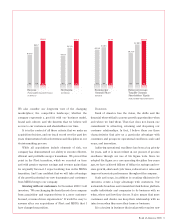
Efficiency: Noninterest expense increased 6 percent to
$28.7 billion from $27.0 billion a year ago, primarily due to the
addition of Fleet and an investment in the capital markets
business. Included in 2005 expenses were $412 million in
pre-tax merger and restructuring charges related to the Fleet
merger. Full-year 2005 cost savings from the merger with Fleet
were $1.85 billion. The efficiency ratio for 2005 was 50.4 per-
cent, reaching the company’s long-term target of 50 percent.
Credit Quality: Credit costs increased. Provision expense
was $4.0 billion in 2005, a 45 percent increase from 2004.
Net charge-offs totaled $4.6 billion, or 0.85 percent of loans
and leases, compared to $3.1 billion, or 0.66 percent of loans
and leases in 2004. The increase in credit costs was primar-
ily driven by the credit card portfolio, including increased
bankruptcy filings, and a lower provision benefit from the
commercial portfolio as the rate of improvement in credit
quality slowed.
Capital Management: For 2005, Bank of America paid
$7.7 billion in cash dividends to common shareholders. The
company also issued 79.6 million common shares, primarily
related to associate stock options and ownership plans, and
repurchased 126.4 million common shares for $5.8 billion, re-
sulting in a net decrease of 46.9 million common shares.
Business Segment Results: Global Consumer and Small
Business Banking earned $7.2 billion in 2005, a 20 percent
increase from 2004. Revenue grew 15 percent to $28.9 billion,
primarily due to continued strong growth in the card busi-
ness, ongoing deposit account growth, balance growth and
increased activity, which generated increased service charge
income. Also contributing were significantly higher corporate
mortgage banking income, primarily due to a writedown of
mortgage servicing rights in 2004, and the addition of Fleet.
Global Business and Financial Services earned $4.6 bil-
lion, a 19 percent increase from 2004. Results were driven
by strong loan growth across all business lines, which included
the purchase of loans from General Motors Acceptance
Corp. as well as the addition of Fleet. Loan growth was
especially robust in the Northeast. Revenue grew 21 percent
to $11.2 billion.
Average loans and leases grew by $28.8 billion, countering
the effects of continued spread compression. Strong deposit
growth was fueled by increases in Commercial Real Estate
and Business Banking.
Global Capital Markets and Investment Banking net income
declined 10 percent to $1.7 billion in 2005, primarily due
to a decline in the provision benefit as a result of slowing
improvement in credit quality. Revenue was essentially
unchanged at $9.0 billion in 2005 and 2004. Noninterest
income increased 14 percent, led by trading profits and equity
commissions that more than offset the decline in trading-
related net interest income. Investment banking revenue was
down slightly, as were service charges.
Global Wealth and Investment Management increased
its net income by 49 percent, driven by the addition of Fleet,
higher asset management fees, higher loan volume and higher
deposit-related revenue due in part to the migration of
Premier Banking relationships from Global Consumer and
Small Business Banking. Asset management fees increased
21 percent from 2004 due to the addition of Fleet and the
growth of $30.9 billion, or 7 percent, in assets under manage-
ment from Dec. 31, 2004. Revenue increased 25 percent to
$7.4 billion due in part to the migration of relationships from
Global Consumer and Small Business Banking.