Bank of America 2005 Annual Report Download - page 98
Download and view the complete annual report
Please find page 98 of the 2005 Bank of America annual report below. You can navigate through the pages in the report by either clicking on the pages listed below, or by using the keyword search tool below to find specific information within the annual report.-
 1
1 -
2
-
3
-
4
-
5
-
6
-
7
-
8
-
9
-
10
-
11
-
12
-
13
-
14
-
15
-
16
-
17
-
18
-
19
-
20
-
21
-
22
-
23
-
24
-
25
-
26
-
27
-
28
-
29
-
30
-
31
-
32
-
33
-
34
-
35
-
36
-
37
-
38
-
39
-
40
-
41
-
42
-
43
-
44
-
45
-
46
-
47
-
48
-
49
-
50
-
51
-
52
-
53
-
54
-
55
-
56
-
57
-
58
-
59
-
60
-
61
-
62
-
63
-
64
-
65
-
66
-
67
-
68
-
69
-
70
-
71
-
72
-
73
-
74
-
75
-
76
-
77
-
78
-
79
-
80
-
81
-
82
-
83
-
84
-
85
-
86
-
87
-
 88
88 -
 89
89 -
 90
90 -
 91
91 -
 92
92 -
 93
93 -
 94
94 -
 95
95 -
 96
96 -
 97
97 -
 98
98 -
 99
99 -
 100
100 -
 101
101 -
 102
102 -
 103
103 -
 104
104 -
 105
105 -
 106
106 -
 107
107 -
 108
108 -
109
-
110
-
111
-
112
-
113
-
114
-
115
-
116
-
117
-
118
-
119
-
120
-
121
-
122
-
123
-
124
-
125
-
126
-
127
-
128
-
129
-
130
-
131
-
132
-
133
-
134
-
135
-
136
-
137
-
138
-
139
-
140
-
141
-
142
-
143
-
144
-
145
-
146
-
147
-
148
-
149
-
150
-
151
-
152
-
153
-
154
-
155
-
156
-
157
-
158
-
159
-
160
-
161
-
162
-
163
-
164
-
165
-
166
-
167
-
168
-
169
-
170
-
171
-
172
-
173
-
174
-
175
-
176
-
177
-
178
-
179
-
180
-
181
-
182
-
183
-
184
-
185
-
186
-
187
-
188
-
189
-
190
-
191
-
192
-
193
-
194
-
195
-
196
-
197
-
198
-
199
-
200
-
201
-
202
-
203
-
204
-
205
-
206
-
207
-
208
-
209
-
210
-
211
-
212
-
213
 |
 |
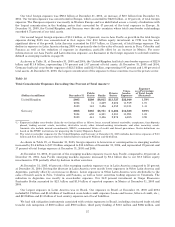
At December 31, 2005, Other Assets included commercial loans held-for-sale of $7.3 billion, of which $45 million was
nonperforming, and leveraged lease partnership interests of $183 million. At December 31, 2005, there were no
nonperforming leveraged lease partnership interests. At December 31, 2004, Other Assets included $1.3 billion and $198
million of commercial loans held-for-sale and leveraged lease partnership interests, of which, $100 million and $23
million were nonperforming.
Commercial loans and leases 90 days or more past due and still accruing interest, were $168 million at
December 31, 2005, an increase of $30 million compared to December 31, 2004. The increase was driven by commercial
—foreign loans in the U.K. See Note 1 of the Consolidated Financial Statements for additional information on past due
commercial loans and leases.
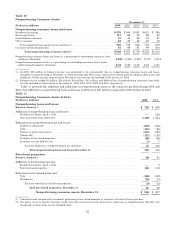
Provision for Credit Losses
The Provision for Credit Losses was $4.0 billion, a 45 percent increase over 2004.
The consumer portion of the Provision for Credit Losses increased $992 million to $4.4 billion in 2005, primarily
driven by consumer net charge-offs of $4.2 billion. Credit card net charge-offs increased $1.3 billion from 2004 to $3.7
billion with an estimated $578 million related to the increase in bankruptcy filings as customers rushed to file ahead of
the new law. Also contributing to the increase in credit card net charge-offs were organic growth and seasoning of the
portfolio, increases effective in 2004 in credit card minimum payment requirements, the impact of the FleetBoston
portfolio and the impact of new advances on accounts for which previous loan balances were sold to the securitization
trusts. We estimate that approximately 70 percent of the bankruptcy-related charge-offs represent acceleration of
charge-offs from 2006. Excluding bankruptcy-related charge-offs representing acceleration from 2006 and charge-offs
associated with the 2004 changes in credit card minimum payment requirements that were provided for in late 2004, the
increased credit card net charge-offs were the primary driver of higher Provision for Credit Losses. In addition, the
Provision for Credit Losses was impacted by new advances on accounts for which previous loan balances were sold to the
securitization trusts, and the establishment of reserves in 2005 for additional changes made in late 2005 in credit card
minimum payment requirements. The establishment of a $50 million reserve associated with Hurricane Katrina for
estimated losses on residential mortgage, home equity and indirect automobile products also contributed to the provision
increase.
The commercial portion of the Provision for Credit Losses increased $161 million to negative $370 million. The
negative provision in 2005 reflects continued improvement in commercial credit quality, although at a slower pace than
experienced in 2004. An improved risk profile in Latin America and reduced uncertainties resulting from the completion
of credit-related integration activities for FleetBoston also drove the negative provision.
The Provision for Credit Losses related to unfunded lending commitments increased $92 million to negative $7
million as the rate of improvement in commercial credit quality slowed.
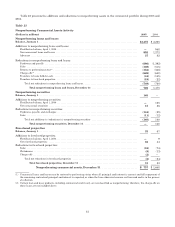
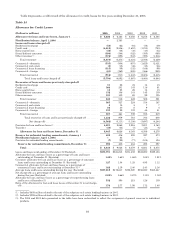
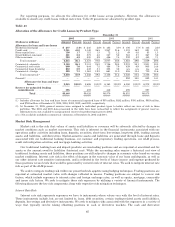
Allowance for Credit Losses
Allowance for Loan and Lease Losses
The Allowance for Loan and Lease Losses is allocated based on two components. We evaluate the adequacy of the
Allowance for Loan and Lease Losses based on the combined total of these two components.
The first component of the Allowance for Loan and Lease Losses covers those commercial loans that are either
nonperforming or impaired. An allowance is allocated when the discounted cash flows (or collateral value or observable
market price) are lower than the carrying value of that loan. For purposes of computing the specific loss component of
the allowance, larger impaired loans are evaluated individually and smaller impaired loans are evaluated as a pool using
historical loss experience for the respective product type and risk rating of the loans.
The second component of the Allowance for Loan and Lease Losses covers performing commercial loans and leases,
and consumer loans. The allowance for commercial loan and lease losses is established by product type after analyzing
historical loss experience by internal risk rating, current economic conditions, industry performance trends, geographic
or obligor concentrations within each portfolio segment, and any other pertinent information. The commercial historical
loss experience is updated quarterly to incorporate the most recent data reflective of the current economic environment.
As of December 31, 2005, quarterly updating of historical loss experience did not have a material impact to the allowance
for commercial loan and lease losses. The allowance for consumer loan and lease losses is based on aggregated portfolio
segment evaluations, generally by product type. Loss forecast models are utilized for consumer products that consider a
variety of factors including, but not limited to, historical loss experience, estimated defaults or foreclosures based on
portfolio trends, delinquencies, economic trends and credit scores. These consumer loss forecast models are updated on a
quarterly basis in order to incorporate information reflective of the current economic environment. As of December 31,
2005, quarterly updating of the loss forecast models to reflect estimated bankruptcy-related net charge-offs accelerated
from 2006 resulted in a decrease in the allowance for consumer loan and lease losses.
62