Bank of America 2005 Annual Report Download - page 54
Download and view the complete annual report
Please find page 54 of the 2005 Bank of America annual report below. You can navigate through the pages in the report by either clicking on the pages listed below, or by using the keyword search tool below to find specific information within the annual report.-
 1
1 -
2
-
3
-
4
-
5
-
6
-
7
-
8
-
9
-
10
-
11
-
12
-
13
-
14
-
15
-
16
-
17
-
18
-
19
-
20
-
21
-
22
-
23
-
24
-
25
-
26
-
27
-
28
-
29
-
30
-
31
-
32
-
33
-
34
-
35
-
36
-
37
-
38
-
39
-
40
-
41
-
42
-
43
-
 44
44 -
 45
45 -
 46
46 -
 47
47 -
 48
48 -
 49
49 -
 50
50 -
 51
51 -
 52
52 -
 53
53 -
 54
54 -
 55
55 -
 56
56 -
 57
57 -
 58
58 -
 59
59 -
 60
60 -
 61
61 -
 62
62 -
 63
63 -
 64
64 -
65
-
66
-
67
-
68
-
69
-
70
-
71
-
72
-
73
-
74
-
75
-
76
-
77
-
78
-
79
-
80
-
81
-
82
-
83
-
84
-
85
-
86
-
87
-
88
-
89
-
90
-
91
-
92
-
93
-
94
-
95
-
96
-
97
-
98
-
99
-
100
-
101
-
102
-
103
-
104
-
105
-
106
-
107
-
108
-
109
-
110
-
111
-
112
-
113
-
114
-
115
-
116
-
117
-
118
-
119
-
120
-
121
-
122
-
123
-
124
-
125
-
126
-
127
-
128
-
129
-
130
-
131
-
132
-
133
-
134
-
135
-
136
-
137
-
138
-
139
-
140
-
141
-
142
-
143
-
144
-
145
-
146
-
147
-
148
-
149
-
150
-
151
-
152
-
153
-
154
-
155
-
156
-
157
-
158
-
159
-
160
-
161
-
162
-
163
-
164
-
165
-
166
-
167
-
168
-
169
-
170
-
171
-
172
-
173
-
174
-
175
-
176
-
177
-
178
-
179
-
180
-
181
-
182
-
183
-
184
-
185
-
186
-
187
-
188
-
189
-
190
-
191
-
192
-
193
-
194
-
195
-
196
-
197
-
198
-
199
-
200
-
201
-
202
-
203
-
204
-
205
-
206
-
207
-
208
-
209
-
210
-
211
-
212
-
213
 |
 |

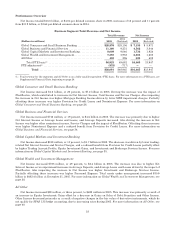
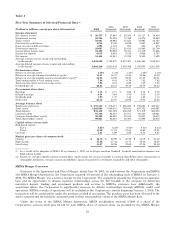
Performance Overview
Net Income totaled $16.5 billion, or $4.04 per diluted common share in 2005, increases of 18 percent and 11 percent
from $13.9 billion, or $3.64 per diluted common share in 2004.
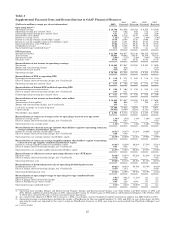
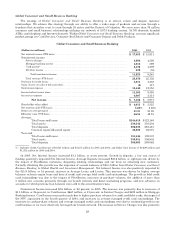
Business Segment Total Revenue and Net Income
Total Revenue Net Income
(Dollars in millions) 2005 2004
(Restated) 2005 2004
(Restated)
Global Consumer and Small Business Banking .................. $28,876 $25,156 $ 7,156 $ 5,971
Global Business and Financial Services ........................ 11,160 9,251 4,562 3,844
Global Capital Markets and Investment Banking ................ 9,009 9,046 1,736 1,924
Global Wealth and Investment Management .................... 7,393 5,933 2,388 1,605
AllOther .................................................. 485 296 623 603
Total FTE basis(1) ....................................... 56,923 49,682 16,465 13,947
FTE adjustment(1) ........................................... (832) (717) ——
Total .............................................. $56,091 $48,965 $16,465 $13,947
(1) Total revenue for the segments and All Other is on a fully taxable-equivalent (FTE) basis. For more information on a FTE basis, see
Supplemental Financial Data beginning on page 24.
Global Consumer and Small Business Banking
Net Income increased $1.2 billion, or 20 percent, to $7.2 billion in 2005. Driving the increase was the impact of
FleetBoston, which contributed to increases in Net Interest Income, Card Income and Service Charges. Also impacting
the increase in Net Income was higher Mortgage Banking Income driven by lower MSR impairment charges. Partially
offsetting these increases was higher Provision for Credit Losses and Noninterest Expense. For more information on
Global Consumer and Small Business Banking, see page 28.
Global Business and Financial Services
Net Income increased $718 million, or 19 percent, to $4.6 billion in 2005. The increase was primarily due to higher
Net Interest Income as Average Loans and Leases, and Average Deposits increased. Also driving the increase in Net
Income was higher other noninterest income, Service Charges and the impact of FleetBoston. Offsetting these increases
were higher Noninterest Expense and a reduced benefit from Provision for Credit Losses. For more information on
Global Business and Financial Services, see page 34.
Global Capital Markets and Investment Banking
Net Income decreased $188 million, or 10 percent, to $1.7 billion in 2005. The decrease was driven by lower trading-
related Net Interest Income and Service Charges, and a reduced benefit from Provision for Credit Losses partially offset
by higher Trading Account Profits, Equity Investment Gains, and Investment and Brokerage Services Income. For more
information on Global Capital Markets and Investment Banking, see page 35.
Global Wealth and Investment Management
Net Income increased $783 million, or 49 percent, to $2.4 billion in 2005. The increase was due to higher Net
Interest Income as we experienced increases in Average Deposits, and Average Loans and Leases driven by the impact of
FleetBoston. Also impacting the increase in Net Income was higher Investment and Brokerage Services Income.
Partially offsetting these increases was higher Personnel Expense. Total assets under management increased $30.9
billion to $482.4 billion at December 31, 2005. For more information on Global Wealth and Investment Management, see
page 38.
All Other
Net Income increased $20 million, or three percent, to $623 million in 2005. This increase was primarily a result of
an increase in Equity Investment Gains offset by a decrease in Gains on Sales of Debt Securities and Other Income.
Other Income decreased primarily as a result of negative changes in the fair value of derivative instruments, which do
not qualify for SFAS 133 hedge accounting, due to increasing rates during 2005. For more information on All Other, see
page 40.
18