Bank of America 2005 Annual Report Download - page 130
Download and view the complete annual report
Please find page 130 of the 2005 Bank of America annual report below. You can navigate through the pages in the report by either clicking on the pages listed below, or by using the keyword search tool below to find specific information within the annual report.-
 1
1 -
2
-
3
-
4
-
5
-
6
-
7
-
8
-
9
-
10
-
11
-
12
-
13
-
14
-
15
-
16
-
17
-
18
-
19
-
20
-
21
-
22
-
23
-
24
-
25
-
26
-
27
-
28
-
29
-
30
-
31
-
32
-
33
-
34
-
35
-
36
-
37
-
38
-
39
-
40
-
41
-
42
-
43
-
44
-
45
-
46
-
47
-
48
-
49
-
50
-
51
-
52
-
53
-
54
-
55
-
56
-
57
-
58
-
59
-
60
-
61
-
62
-
63
-
64
-
65
-
66
-
67
-
68
-
69
-
70
-
71
-
72
-
73
-
74
-
75
-
76
-
77
-
78
-
79
-
80
-
81
-
82
-
83
-
84
-
85
-
86
-
87
-
88
-
89
-
90
-
91
-
92
-
93
-
94
-
95
-
96
-
97
-
98
-
99
-
100
-
101
-
102
-
103
-
104
-
105
-
106
-
107
-
108
-
109
-
110
-
111
-
112
-
113
-
114
-
115
-
116
-
117
-
118
-
119
-
 120
120 -
 121
121 -
 122
122 -
 123
123 -
 124
124 -
 125
125 -
 126
126 -
 127
127 -
 128
128 -
 129
129 -
 130
130 -
 131
131 -
 132
132 -
 133
133 -
 134
134 -
 135
135 -
 136
136 -
 137
137 -
 138
138 -
 139
139 -
 140
140 -
141
-
142
-
143
-
144
-
145
-
146
-
147
-
148
-
149
-
150
-
151
-
152
-
153
-
154
-
155
-
156
-
157
-
158
-
159
-
160
-
161
-
162
-
163
-
164
-
165
-
166
-
167
-
168
-
169
-
170
-
171
-
172
-
173
-
174
-
175
-
176
-
177
-
178
-
179
-
180
-
181
-
182
-
183
-
184
-
185
-
186
-
187
-
188
-
189
-
190
-
191
-
192
-
193
-
194
-
195
-
196
-
197
-
198
-
199
-
200
-
201
-
202
-
203
-
204
-
205
-
206
-
207
-
208
-
209
-
210
-
211
-
212
-
213
 |
 |

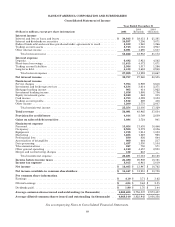
BANK OF AMERICA CORPORATION AND SUBSIDIARIES
Notes to Consolidated Financial Statements—(Continued)
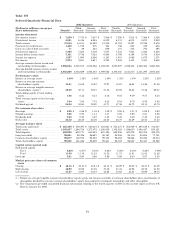
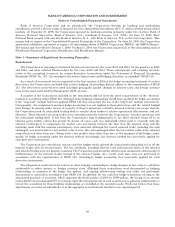
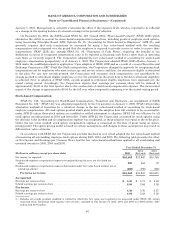
The following table sets forth the effects of the adjustments on Net Income for the years 2004 and 2003. Since we
could not apply hedge accounting for those transactions, the derivative transactions have been marked to market
through the Consolidated Statement of Income with no related offset for hedge accounting.
Increase (Decrease) in Net Income (1)
Year Ended December 31
(Dollars in millions) 2004 2003
As Previously Reported net income ........................................... $14,143 $10,810
Internalfairvaluehedges .................................................. (190) (144)
Internal cash flow hedges ................................................... (281) 104
Other,net ................................................................ 275 (9)
Totaladjustment ...................................................... (196) (49)
Restated net income ....................................................... $13,947 $10,762
Percent change ............................................................ (1.4)% (0.5)%
(1) For presentation purposes, certain numbers have been rounded.
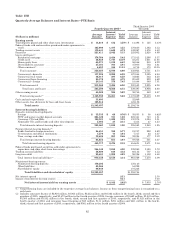
The following tables set forth the effects of the restatement adjustments on affected line items within our previously
reported Consolidated Statement of Income for the years 2004 and 2003, Consolidated Balance Sheet as of December 31,
2004, Consolidated Statement of Changes in Shareholders’ Equity for the years 2004 and 2003, and Consolidated
Statement of Cash Flows for the years 2004 and 2003.
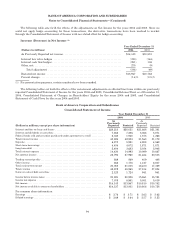
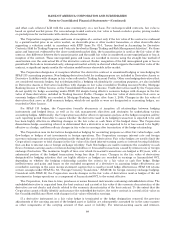
Bank of America Corporation and Subsidiaries
Consolidated Statement of Income
Year Ended December 31
2004 2003
(Dollars in millions, except per share information)
As
Previously
Reported Restated
As
Previously
Reported Restated
Interest and fees on loans and leases ......................................... $28,213 $28,051 $21,668 $21,381
Interest and dividends on securities .......................................... 7,262 7,256 3,068 3,071
Federal funds sold and securities purchased under agreements to resell ........... 2,043 1,940 1,373 1,266
Totalinterestincome....................................................... 43,224 42,953 31,563 31,172
Deposits .................................................................. 6,275 5,921 4,908 4,562
Short-term borrowings ..................................................... 4,434 4,072 1,871 1,871
Long-term debt ............................................................ 2,404 3,683 2,034 2,948
Total interest expense ...................................................... 14,430 14,993 10,099 10,667
Netinterestincome ........................................................ 28,794 27,960 21,464 20,505
Trading account profits ..................................................... 869 869 409 408
Otherincome.............................................................. 858 1,778 1,127 2,007
Total noninterest income ................................................... 20,085 21,005 16,450 17,329
Total revenue ............................................................. 48,879 48,965 37,914 37,834
Gains on sales of debt securities ............................................. 2,123 1,724 941 941
Income before income taxes ................................................. 21,221 20,908 15,861 15,781
Income tax expense ........................................................ 7,078 6,961 5,051 5,019
Netincome................................................................ $14,143 $13,947 $10,810 $10,762
Net income available to common shareholders ................................. $14,127 $13,931 $10,806 $10,758
Per common share information
Earnings ................................................................. $ 3.76 $ 3.71 $ 3.63 $ 3.62
Dilutedearnings........................................................... $ 3.69 $ 3.64 $ 3.57 $ 3.55
94