Bank of America 2005 Annual Report Download - page 117
Download and view the complete annual report
Please find page 117 of the 2005 Bank of America annual report below. You can navigate through the pages in the report by either clicking on the pages listed below, or by using the keyword search tool below to find specific information within the annual report.-
 1
1 -
2
-
3
-
4
-
5
-
6
-
7
-
8
-
9
-
10
-
11
-
12
-
13
-
14
-
15
-
16
-
17
-
18
-
19
-
20
-
21
-
22
-
23
-
24
-
25
-
26
-
27
-
28
-
29
-
30
-
31
-
32
-
33
-
34
-
35
-
36
-
37
-
38
-
39
-
40
-
41
-
42
-
43
-
44
-
45
-
46
-
47
-
48
-
49
-
50
-
51
-
52
-
53
-
54
-
55
-
56
-
57
-
58
-
59
-
60
-
61
-
62
-
63
-
64
-
65
-
66
-
67
-
68
-
69
-
70
-
71
-
72
-
73
-
74
-
75
-
76
-
77
-
78
-
79
-
80
-
81
-
82
-
83
-
84
-
85
-
86
-
87
-
88
-
89
-
90
-
91
-
92
-
93
-
94
-
95
-
96
-
97
-
98
-
99
-
100
-
101
-
102
-
103
-
104
-
105
-
106
-
 107
107 -
 108
108 -
 109
109 -
 110
110 -
 111
111 -
 112
112 -
 113
113 -
 114
114 -
 115
115 -
 116
116 -
 117
117 -
 118
118 -
 119
119 -
 120
120 -
 121
121 -
 122
122 -
 123
123 -
 124
124 -
 125
125 -
 126
126 -
 127
127 -
128
-
129
-
130
-
131
-
132
-
133
-
134
-
135
-
136
-
137
-
138
-
139
-
140
-
141
-
142
-
143
-
144
-
145
-
146
-
147
-
148
-
149
-
150
-
151
-
152
-
153
-
154
-
155
-
156
-
157
-
158
-
159
-
160
-
161
-
162
-
163
-
164
-
165
-
166
-
167
-
168
-
169
-
170
-
171
-
172
-
173
-
174
-
175
-
176
-
177
-
178
-
179
-
180
-
181
-
182
-
183
-
184
-
185
-
186
-
187
-
188
-
189
-
190
-
191
-
192
-
193
-
194
-
195
-
196
-
197
-
198
-
199
-
200
-
201
-
202
-
203
-
204
-
205
-
206
-
207
-
208
-
209
-
210
-
211
-
212
-
213
 |
 |

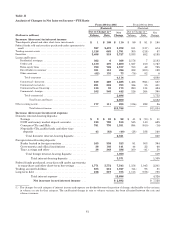
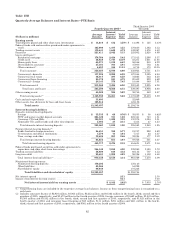
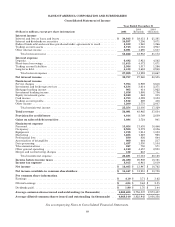
Table II
Analysis of Changes in Net Interest Income—FTE Basis
From 2004 to 2005 From 2003 to 2004
(Restated) (Restated)
Due to Change in(1) Net
Change
Due to Change in(1) Net
Change(Dollars in millions) Volume Rate Volume Rate
Increase (decrease) in interest income
Time deposits placed and other short-term investments ......... $ 1 $ 109 $ 110 $ 99 $ 91 $ 190
Federal funds sold and securities purchased under agreements to
resell ................................................... 597 2,475 3,072 811 (137) 674
Trading account assets ...................................... 1,128 663 1,791 305 (218) 87
Securities ................................................. 3,408 319 3,727 3,533 652 4,185
Loans and leases:
Residential mortgage ................................... 362 6 368 2,176 7 2,183
Creditcard ............................................ 1,130 470 1,600 1,557 210 1,767
Homeequitylines ...................................... 788 789 1,577 753 42 795
Direct/Indirect consumer ................................ 381 115 496 332 (203) 129
Other consumer ........................................ (62) 135 73 (76) 82 6
Total consumer ..................................... 4,114 4,880
Commercial—domestic .................................. 819 469 1,288 1,458 (921) 537
Commercial real estate .................................. 281 502 783 346 55 401
Commercial lease financing .............................. 138 35 173 290 134 424
Commercial—foreign .................................... 102 340 442 126 264 390
Total commercial ................................... 2,686 1,752
Total loans and leases ........................... 6,800 6,632
Other earning assets ........................................ 177 111 288 (136) 222 86
Totalinterestincome ............................ $15,788 $11,854
Increase (decrease) in interest expense
Domestic interest-bearing deposits:
Savings ......................................... $9$83$92$ 41 $ (30) $ 11
NOW and money market deposit accounts ........... 128 790 918 545 140 685
ConsumerCDsandIRAs.......................... 781 770 1,551 894 (910) (16)
Negotiable CDs, public funds and other time
deposits ...................................... 43 (83) (40) (28) 188 160
Total domestic interest-bearing deposits ......... 2,521 840
Foreign interest-bearing deposits:
Banks located in foreign countries .................. 165 358 523 91 303 394
Governments and official institutions ............... 38 103 141 44 22 66
Time,savingsandother .......................... 38 348 386 100 (41) 59
Total foreign interest-bearing deposits .......... 1,050 519
Total interest-bearing deposits ............. 3,571 1,359
Federal funds purchased, securities sold under agreements
to repurchase and other short-term borrowings ........ 1,771 5,772 7,543 1,156 1,045 2,201
Trading account liabilities ............................ 835 212 1,047 (64) 95 31
Long-term debt ...................................... 216 519 735 1,113 (378) 735
Total interest expense .................... 12,896 4,326
Net increase in net interest income ... $ 2,892 $ 7,528
(1) The changes for each category of interest income and expense are divided between the portion of change attributable to the variance
in volume or rate for that category. The unallocated change in rate or volume variance has been allocated between the rate and
volume variances.
81