Bank of America 2005 Annual Report Download - page 114
Download and view the complete annual report
Please find page 114 of the 2005 Bank of America annual report below. You can navigate through the pages in the report by either clicking on the pages listed below, or by using the keyword search tool below to find specific information within the annual report.-
 1
1 -
2
-
3
-
4
-
5
-
6
-
7
-
8
-
9
-
10
-
11
-
12
-
13
-
14
-
15
-
16
-
17
-
18
-
19
-
20
-
21
-
22
-
23
-
24
-
25
-
26
-
27
-
28
-
29
-
30
-
31
-
32
-
33
-
34
-
35
-
36
-
37
-
38
-
39
-
40
-
41
-
42
-
43
-
44
-
45
-
46
-
47
-
48
-
49
-
50
-
51
-
52
-
53
-
54
-
55
-
56
-
57
-
58
-
59
-
60
-
61
-
62
-
63
-
64
-
65
-
66
-
67
-
68
-
69
-
70
-
71
-
72
-
73
-
74
-
75
-
76
-
77
-
78
-
79
-
80
-
81
-
82
-
83
-
84
-
85
-
86
-
87
-
88
-
89
-
90
-
91
-
92
-
93
-
94
-
95
-
96
-
97
-
98
-
99
-
100
-
101
-
102
-
103
-
 104
104 -
 105
105 -
 106
106 -
 107
107 -
 108
108 -
 109
109 -
 110
110 -
 111
111 -
 112
112 -
 113
113 -
 114
114 -
 115
115 -
 116
116 -
 117
117 -
 118
118 -
 119
119 -
 120
120 -
 121
121 -
 122
122 -
 123
123 -
 124
124 -
125
-
126
-
127
-
128
-
129
-
130
-
131
-
132
-
133
-
134
-
135
-
136
-
137
-
138
-
139
-
140
-
141
-
142
-
143
-
144
-
145
-
146
-
147
-
148
-
149
-
150
-
151
-
152
-
153
-
154
-
155
-
156
-
157
-
158
-
159
-
160
-
161
-
162
-
163
-
164
-
165
-
166
-
167
-
168
-
169
-
170
-
171
-
172
-
173
-
174
-
175
-
176
-
177
-
178
-
179
-
180
-
181
-
182
-
183
-
184
-
185
-
186
-
187
-
188
-
189
-
190
-
191
-
192
-
193
-
194
-
195
-
196
-
197
-
198
-
199
-
200
-
201
-
202
-
203
-
204
-
205
-
206
-
207
-
208
-
209
-
210
-
211
-
212
-
213
 |
 |
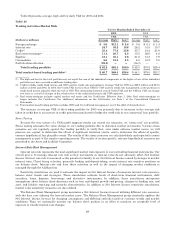
reflected higher credit card net charge-offs of $791 million in part due to the impact of the FleetBoston credit card
portfolio, organic growth and continued seasoning of accounts, and new advances on accounts for which previous loan
balances were sold to the securitization trusts. Also contributing to the consumer provision was the establishment of
reserves for changes made to card minimum payment requirements.
Gains on Sales of Debt Securities
Gains on Sales of Debt Securities in 2004 and 2003, were $1.7 billion and $941 million, as we continued to reposition
the ALM portfolio in response to interest rate fluctuations and to manage mortgage prepayment risk.
Noninterest Expense
Noninterest Expense increased $6.9 billion in 2004 from 2003, due primarily to higher Personnel Expense, increased
Other General Operating Expense, and higher Merger and Restructuring Charges. Personnel Expense increased $3.0
billion primarily due to the impact of FleetBoston associates. Other General Operating Expense increased $1.5 billion
related to the impact of FleetBoston, $370 million of litigation expenses incurred during 2004 and the $285 million
related to the mutual fund settlement. Merger and Restructuring Charges were $618 million in connection with the
integration of FleetBoston’s operations.
Income Tax Expense
Income Tax Expense was $7.0 billion, reflecting an effective tax rate of 33.3 percent, in 2004 compared to $5.0 billion
and 31.8 percent, in 2003. The difference in the effective tax rate between years resulted primarily from the application
of purchase accounting to certain leveraged leases acquired in the FleetBoston Merger, an increase in state tax expense
generally related to higher tax rates in the Northeast and the reduction in 2003 of Income Tax Expense resulting from a
tax settlement with the Internal Revenue Service.
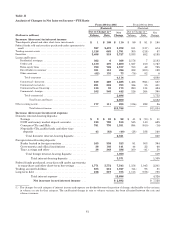
Business Segment Operations
Global Consumer and Small Business Banking
Total Revenue increased $5.6 billion, or 28 percent, in 2004 compared to 2003, primarily due to the impact of
FleetBoston. Overall loan and deposit growth from the impact of FleetBoston customers contributed to the $4.9 billion,
or 44 percent, increase in Net Interest Income. This increase was largely due to the net effect of growth in consumer
loans and leases, deposit balances and ALM activities. Increases in Card Income of 51 percent, and Service Charges of 26
percent drove the $703 million, or eight percent, increase in Noninterest Income. FleetBoston also contributed to the
increase in Noninterest Income. Partially offsetting these increases was a decrease in Mortgage Banking Income of 72
percent. Net Income rose $642 million, or 12 percent, due to the increases in Net Interest Income and Noninterest
Income discussed above, offset by increases in the Provision for Credit Losses and Noninterest Expense. Higher credit
card net charge-offs, the impact of the FleetBoston credit card portfolio, organic growth and seasoning of credit card
accounts, new advances on accounts for which previous loan balances were sold to the securitization trusts, and
increases in card minimum payment requirements resulted in a $1.6 billion, or 97 percent, increase in the Provision for
Credit Losses. Noninterest Expense increased $3.0 billion, or 31 percent, due to increases in Processing Costs, Personnel
Expense and Other General Operating Expense related to the impact of FleetBoston.
Global Business and Financial Services
Total Revenue increased $3.4 billion, or 58 percent, in 2004 compared to 2003. Net Interest Income increased $2.3
billion, or 54 percent, largely due to the increase in commercial loans and leases, deposit balances driven by the impact
of FleetBoston earning assets and the net results of ALM activities. Noninterest Income increased $1.1 billion, or 68
percent due to increases in Other Noninterest Income and increases in Service Charges, driven by the impact of
FleetBoston. Noninterest Expense increased $1.5 billion, or 70 percent, due to the impact of FleetBoston. Net Income
rose $1.8 billion, or 85 percent, due to the increases discussed above. Also impacting Net Income was the Provision for
Credit Losses which declined $968 million to negative $442 million, driven by a notable improvement in credit quality
and a $395 million decrease in net charge-offs.
Global Capital Markets and Investment Banking
Total Revenue increased $695 million, or eight percent, in 2004 compared to 2003 driven by an increase in
Noninterest Income. Net Interest Income decreased $175 million, or four percent, driven by a $196 million, or nine
percent decrease in trading-related Net Interest Income. Noninterest Income increased $870 million, or 21 percent,
resulting from increases in Trading Account Profits, Investment Banking Income, and Service Charges. In 2004, Net
Income increased $174 million, or 10 percent, due to the increase in Noninterest Income and lower Provision for Credit
78