Bank of America 2005 Annual Report Download - page 190
Download and view the complete annual report
Please find page 190 of the 2005 Bank of America annual report below. You can navigate through the pages in the report by either clicking on the pages listed below, or by using the keyword search tool below to find specific information within the annual report.-
 1
1 -
2
-
3
-
4
-
5
-
6
-
7
-
8
-
9
-
10
-
11
-
12
-
13
-
14
-
15
-
16
-
17
-
18
-
19
-
20
-
21
-
22
-
23
-
24
-
25
-
26
-
27
-
28
-
29
-
30
-
31
-
32
-
33
-
34
-
35
-
36
-
37
-
38
-
39
-
40
-
41
-
42
-
43
-
44
-
45
-
46
-
47
-
48
-
49
-
50
-
51
-
52
-
53
-
54
-
55
-
56
-
57
-
58
-
59
-
60
-
61
-
62
-
63
-
64
-
65
-
66
-
67
-
68
-
69
-
70
-
71
-
72
-
73
-
74
-
75
-
76
-
77
-
78
-
79
-
80
-
81
-
82
-
83
-
84
-
85
-
86
-
87
-
88
-
89
-
90
-
91
-
92
-
93
-
94
-
95
-
96
-
97
-
98
-
99
-
100
-
101
-
102
-
103
-
104
-
105
-
106
-
107
-
108
-
109
-
110
-
111
-
112
-
113
-
114
-
115
-
116
-
117
-
118
-
119
-
120
-
121
-
122
-
123
-
124
-
125
-
126
-
127
-
128
-
129
-
130
-
131
-
132
-
133
-
134
-
135
-
136
-
137
-
138
-
139
-
140
-
141
-
142
-
143
-
144
-
145
-
146
-
147
-
148
-
149
-
150
-
151
-
152
-
153
-
154
-
155
-
156
-
157
-
158
-
159
-
160
-
161
-
162
-
163
-
164
-
165
-
166
-
167
-
168
-
169
-
170
-
171
-
172
-
173
-
174
-
175
-
176
-
177
-
178
-
179
-
 180
180 -
 181
181 -
 182
182 -
 183
183 -
 184
184 -
 185
185 -
 186
186 -
 187
187 -
 188
188 -
 189
189 -
 190
190 -
 191
191 -
 192
192 -
 193
193 -
 194
194 -
 195
195 -
 196
196 -
 197
197 -
 198
198 -
 199
199 -
 200
200 -
201
-
202
-
203
-
204
-
205
-
206
-
207
-
208
-
209
-
210
-
211
-
212
-
213
 |
 |

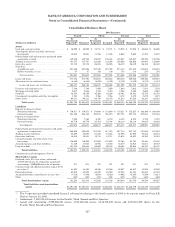
BANK OF AMERICA CORPORATION AND SUBSIDIARIES
Notes to Consolidated Financial Statements—(Continued)
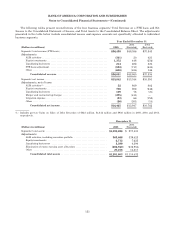
Note 22—Performance by Geographical Area
Since the Corporation’s operations are highly integrated, certain asset, liability, income and expense amounts must
be allocated to arrive at Total Assets, Total Revenue, Income (Loss) Before Income Taxes and Net Income (Loss) by
geographic area. The Corporation identifies its geographic performance based upon the business unit structure used to
manage the capital or expense deployed in the region as applicable. This requires certain judgments related to the
allocation of revenue so that revenue can be appropriately matched with the related expense or capital deployed in the
region.
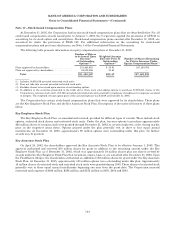
At December 31 Year Ended December 31
(Dollars in millions) Year Total
Assets(1)
Total
Revenue(2)
Income (Loss)
Before Income
Taxes
Net
Income
(Loss)
Domestic(3) .............................................
(Restated)
(Restated)
2005
2004
2003
$1,195,212
1,046,727
$52,714
46,252
36,444
$22,790
19,852
15,859
$15,357
13,246
10,786
Asia................................................... 2005
2004
2003
28,442
21,658
727
674
416
360
260
57
255
192
54
Europe, Middle East and Africa ........................... 2005
2004
2003
51,917
27,580
1,257
1,136
850
355
335
25
229
224
23
Latin America and the Caribbean ......................... 2005
2004
2003
16,232
14,467
1,393
903
124
975
461
(160)
624
285
(101)
Total Foreign ................................ 2005
2004
2003
96,591
63,705
3,377
2,713
1,390
1,690
1,056
(78)
1,108
701
(24)
Total Consolidated ......................
(Restated)
(Restated)
2005
2004
2003
$1,291,803
1,110,432
$56,091
48,965
37,834
$24,480
20,908
15,781
$16,465
13,947
10,762
(1) Total Assets includes long-lived assets, which are primarily located in the U.S.
(2) There were no material intercompany revenues between geographic regions for any of the periods presented.
(3) Includes the Corporation’s Canadian operations, which had Total Assets of $4,052 million and $4,849 million at December 31, 2005
and 2004; Total Revenue of $113 million, $88 million, and $96 million; Income before Income Taxes of $66 million, $49 million, and
$60 million; and Net Income of $56 million, $41 million, and $12 million for the years ended December 31, 2005, 2004 and 2003.
154