Bank of America 2005 Annual Report Download - page 3
Download and view the complete annual report
Please find page 3 of the 2005 Bank of America annual report below. You can navigate through the pages in the report by either clicking on the pages listed below, or by using the keyword search tool below to find specific information within the annual report.-
 1
1 -
 2
2 -
 3
3 -
 4
4 -
 5
5 -
 6
6 -
 7
7 -
 8
8 -
 9
9 -
 10
10 -
 11
11 -
 12
12 -
 13
13 -
 14
14 -
15
-
16
-
17
-
18
-
19
-
20
-
21
-
22
-
23
-
24
-
25
-
26
-
27
-
28
-
29
-
30
-
31
-
32
-
33
-
34
-
35
-
36
-
37
-
38
-
39
-
40
-
41
-
42
-
43
-
44
-
45
-
46
-
47
-
48
-
49
-
50
-
51
-
52
-
53
-
54
-
55
-
56
-
57
-
58
-
59
-
60
-
61
-
62
-
63
-
64
-
65
-
66
-
67
-
68
-
69
-
70
-
71
-
72
-
73
-
74
-
75
-
76
-
77
-
78
-
79
-
80
-
81
-
82
-
83
-
84
-
85
-
86
-
87
-
88
-
89
-
90
-
91
-
92
-
93
-
94
-
95
-
96
-
97
-
98
-
99
-
100
-
101
-
102
-
103
-
104
-
105
-
106
-
107
-
108
-
109
-
110
-
111
-
112
-
113
-
114
-
115
-
116
-
117
-
118
-
119
-
120
-
121
-
122
-
123
-
124
-
125
-
126
-
127
-
128
-
129
-
130
-
131
-
132
-
133
-
134
-
135
-
136
-
137
-
138
-
139
-
140
-
141
-
142
-
143
-
144
-
145
-
146
-
147
-
148
-
149
-
150
-
151
-
152
-
153
-
154
-
155
-
156
-
157
-
158
-
159
-
160
-
161
-
162
-
163
-
164
-
165
-
166
-
167
-
168
-
169
-
170
-
171
-
172
-
173
-
174
-
175
-
176
-
177
-
178
-
179
-
180
-
181
-
182
-
183
-
184
-
185
-
186
-
187
-
188
-
189
-
190
-
191
-
192
-
193
-
194
-
195
-
196
-
197
-
198
-
199
-
200
-
201
-
202
-
203
-
204
-
205
-
206
-
207
-
208
-
209
-
210
-
211
-
212
-
213
 |
 |

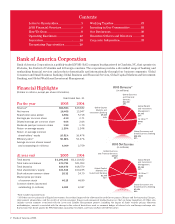
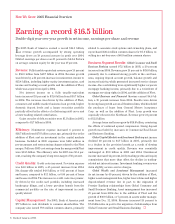
Financial Highlights
(Dollars in millions, except per share information)
Year Ended Dec. 31
For the year 2005 2004
Revenue* $56,923 $49,682
Net income 16,465 13,947
Shareholder value added 6,594 5,718
Earnings per common share 4.10 3.71
Diluted earnings per common share 4.04 3.64
Dividends paid per common share 1.90 1.70
Return on average assets 1.30% 1.34%
Return on average common
shareholders’ equity 16.51% 16.47%
Efficiency ratio* 50.38% 54.37%
Average common shares issued
and outstanding (in millions) 4,009 3,759
At year end 2005 2004
Total assets $ 1,291,803 $1,110,432
Total loans and leases 573,791 521,813
Total deposits 634,670 618,570
Total shareholders’ equity 101,533 100,235
Book value per common share 25.32 24.70
Market price per share
of common stock 46.15 46.99
Common shares issued and
outstanding (in millions) 4,000 4,047
Contents
Letter to Shareholders ..........................................3
2005 Financial Overview .....................................8
How We Grow ...............................................................9
Operating Excellence ...........................................10
Innovation ....................................................................16
Recognizing Opportunities ............................20
Working Together .................................................. 23
Investing in Our Communities ....................26
Our Businesses ........................................................30
Executive Officers and Directors ................31
Corporate Information ....................................... 32
2005 Revenue*
(in millions)
Global Consumer and
Small Business Banking
$28,876
51%
All Other**
$485
1%
Global Wealth
and Investment
Management
$7,393
13%
Global Business
and Financial
Services
$11,160
19%
Global Capital
Markets and
Investment Banking
$9,009
16%
Bank of America Corporation
2 Bank of America 2005
Bank of America Corporation is a publicly traded (NYSE: BAC) company headquartered in Charlotte, NC, that operates in
29 states, the District of Columbia and 43 foreign countries. The corporation provides a diversified range of banking and
nonbanking financial services and products domestically and internationally through four business segments: Global
Consumer and Small Business Banking, Global Business and Financial Services, Global Capital Markets and Investment
Banking, and Global Wealth and Investment Management.
2005 Net Income
(in millions)
Global Consumer and
Small Business Banking
$7,156
43%
All Other**
$623
4%
Global Wealth
and Investment
Management
$2,388
14%
Global Business
and Financial Services
$4,562
28%
Global Capital
Markets and
Investment Banking
$1,736
11%
*Fully taxable-equivalent basis
**All Other consists primarily of Equity Investments, the residual impact of the allowance for credit losses process, Merger and Restructuring Charges,
intersegment eliminations, and the results of certain consumer finance and commercial lending businesses that are being liquidated. All Other also
includes certain amounts associated with the Asset and Liability Management process, including the impact of funds transfer pricing allocation
methodologies, amounts associated with the change in the value of derivatives used as economic hedges of interest rate and foreign exchange rate
fluctuations that do not qualify for SFAS 133 hedge accounting treatment, and Gains on Sales of Debt Securities.