Bank of America 2005 Annual Report Download - page 56
Download and view the complete annual report
Please find page 56 of the 2005 Bank of America annual report below. You can navigate through the pages in the report by either clicking on the pages listed below, or by using the keyword search tool below to find specific information within the annual report.-
 1
1 -
2
-
3
-
4
-
5
-
6
-
7
-
8
-
9
-
10
-
11
-
12
-
13
-
14
-
15
-
16
-
17
-
18
-
19
-
20
-
21
-
22
-
23
-
24
-
25
-
26
-
27
-
28
-
29
-
30
-
31
-
32
-
33
-
34
-
35
-
36
-
37
-
38
-
39
-
40
-
41
-
42
-
43
-
44
-
45
-
 46
46 -
 47
47 -
 48
48 -
 49
49 -
 50
50 -
 51
51 -
 52
52 -
 53
53 -
 54
54 -
 55
55 -
 56
56 -
 57
57 -
 58
58 -
 59
59 -
 60
60 -
 61
61 -
 62
62 -
 63
63 -
 64
64 -
 65
65 -
 66
66 -
67
-
68
-
69
-
70
-
71
-
72
-
73
-
74
-
75
-
76
-
77
-
78
-
79
-
80
-
81
-
82
-
83
-
84
-
85
-
86
-
87
-
88
-
89
-
90
-
91
-
92
-
93
-
94
-
95
-
96
-
97
-
98
-
99
-
100
-
101
-
102
-
103
-
104
-
105
-
106
-
107
-
108
-
109
-
110
-
111
-
112
-
113
-
114
-
115
-
116
-
117
-
118
-
119
-
120
-
121
-
122
-
123
-
124
-
125
-
126
-
127
-
128
-
129
-
130
-
131
-
132
-
133
-
134
-
135
-
136
-
137
-
138
-
139
-
140
-
141
-
142
-
143
-
144
-
145
-
146
-
147
-
148
-
149
-
150
-
151
-
152
-
153
-
154
-
155
-
156
-
157
-
158
-
159
-
160
-
161
-
162
-
163
-
164
-
165
-
166
-
167
-
168
-
169
-
170
-
171
-
172
-
173
-
174
-
175
-
176
-
177
-
178
-
179
-
180
-
181
-
182
-
183
-
184
-
185
-
186
-
187
-
188
-
189
-
190
-
191
-
192
-
193
-
194
-
195
-
196
-
197
-
198
-
199
-
200
-
201
-
202
-
203
-
204
-
205
-
206
-
207
-
208
-
209
-
210
-
211
-
212
-
213
 |
 |

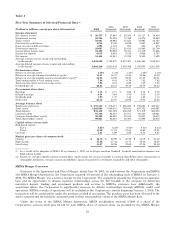
For more information on credit quality, see Credit Risk Management beginning on page 49.
Gains on Sales of Debt Securities
Gains on Sales of Debt Securities in 2005 were $1.1 billion compared to $1.7 billion in 2004. For more information on
Gains on Sales of Debt Securities, see Market Risk Management beginning on page 65.
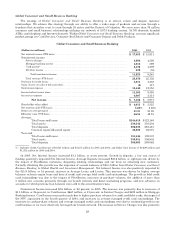
Noninterest Expense
Noninterest Expense
(Dollars in millions) 2005 2004
Personnel .............................................................. $15,054 $13,435
Occupancy ............................................................. 2,588 2,379
Equipment ............................................................. 1,199 1,214
Marketing ............................................................. 1,255 1,349
Professional fees ........................................................ 930 836
Amortization of intangibles ............................................... 809 664
Data processing ......................................................... 1,487 1,330
Telecommunications ..................................................... 827 730
Othergeneraloperating.................................................. 4,120 4,457
Merger and restructuring charges ......................................... 412 618
Total noninterest expense ......................................... $28,681 $27,012
Noninterest Expense increased $1.7 billion to $28.7 billion in 2005 compared to 2004, primarily due to the impact of
FleetBoston and increases in personnel-related costs. Pre-tax cost savings from the FleetBoston Merger included in the
above were $909 million in 2004 and $1.9 billion in 2005, which exceeded the $1.6 billion estimate in the October 2003
FleetBoston Merger announcement.
Income Tax Expense
Income Tax Expense was $8.0 billion in 2005, reflecting an effective tax rate of 32.7 percent. The effective tax rate
was lower than 2004 primarily as a result of a tax benefit of $70 million related to the special one-time deduction
associated with the repatriation of certain foreign earnings under the American Jobs Creation Act of 2004. In 2004,
Income Tax Expense was $7.0 billion, reflecting an effective tax rate of 33.3 percent. For more information on Income
Tax Expense, see Note 18 of the Consolidated Financial Statements.
20