Bank of America 2005 Annual Report Download - page 94
Download and view the complete annual report
Please find page 94 of the 2005 Bank of America annual report below. You can navigate through the pages in the report by either clicking on the pages listed below, or by using the keyword search tool below to find specific information within the annual report.-
 1
1 -
2
-
3
-
4
-
5
-
6
-
7
-
8
-
9
-
10
-
11
-
12
-
13
-
14
-
15
-
16
-
17
-
18
-
19
-
20
-
21
-
22
-
23
-
24
-
25
-
26
-
27
-
28
-
29
-
30
-
31
-
32
-
33
-
34
-
35
-
36
-
37
-
38
-
39
-
40
-
41
-
42
-
43
-
44
-
45
-
46
-
47
-
48
-
49
-
50
-
51
-
52
-
53
-
54
-
55
-
56
-
57
-
58
-
59
-
60
-
61
-
62
-
63
-
64
-
65
-
66
-
67
-
68
-
69
-
70
-
71
-
72
-
73
-
74
-
75
-
76
-
77
-
78
-
79
-
80
-
81
-
82
-
83
-
 84
84 -
 85
85 -
 86
86 -
 87
87 -
 88
88 -
 89
89 -
 90
90 -
 91
91 -
 92
92 -
 93
93 -
 94
94 -
 95
95 -
 96
96 -
 97
97 -
 98
98 -
 99
99 -
 100
100 -
 101
101 -
 102
102 -
 103
103 -
 104
104 -
105
-
106
-
107
-
108
-
109
-
110
-
111
-
112
-
113
-
114
-
115
-
116
-
117
-
118
-
119
-
120
-
121
-
122
-
123
-
124
-
125
-
126
-
127
-
128
-
129
-
130
-
131
-
132
-
133
-
134
-
135
-
136
-
137
-
138
-
139
-
140
-
141
-
142
-
143
-
144
-
145
-
146
-
147
-
148
-
149
-
150
-
151
-
152
-
153
-
154
-
155
-
156
-
157
-
158
-
159
-
160
-
161
-
162
-
163
-
164
-
165
-
166
-
167
-
168
-
169
-
170
-
171
-
172
-
173
-
174
-
175
-
176
-
177
-
178
-
179
-
180
-
181
-
182
-
183
-
184
-
185
-
186
-
187
-
188
-
189
-
190
-
191
-
192
-
193
-
194
-
195
-
196
-
197
-
198
-
199
-
200
-
201
-
202
-
203
-
204
-
205
-
206
-
207
-
208
-
209
-
210
-
211
-
212
-
213
 |
 |

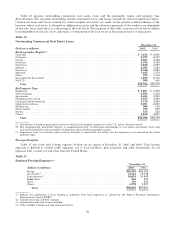
linked certificates of deposit of $59 million and $125 million at December 31, 2005 and 2004. The resulting total foreign
exposure net of risk mitigation for Brazil was $2.3 billion and $2.2 billion at December 31, 2005 and 2004.
On October 13, 2005, we announced an agreement to sell our asset management business in Mexico with $1.8 billion
of assets under management to an entity in which we have a 24.9 percent investment. The sale will be completed in
2006.
In December 2005, we entered into a definitive agreement with a consortium led by Johannesburg-based Standard
Bank Group Ltd for the sale of BankBoston Argentina assets and the assumption of liabilities. The transaction is subject
to obtaining all necessary regulatory approvals.
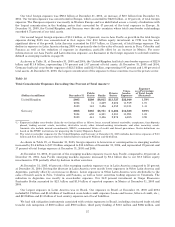
Table 19 sets forth regional foreign exposure to selected countries defined as emerging markets.
Table 19
Selected Emerging Markets(1)
(Dollars in millions)
Loans and
Leases, and
Loan
Commitments Other
Financing(2)
Derivative
Assets(3)
Securities/
Other
Investments(4)
Total
Cross-
border
Exposure(5)
Local
Country
Exposure
Net of
Local
Liabilities(6)
Total
Foreign
Exposure
December 31,
2005
Increase/
(Decrease)
from
December 31,
2004
Region/Country
Asia Pacific
China(7) ................. $ 172 $ 91 $110 $3,031 $ 3,404 $ — $ 3,404 $3,296
India ................... 547 176 341 482 1,546 45 1,591 99
South Korea ............. 267 474 52 305 1,098 57 1,155 (228)
Taiwan ................. 266 77 84 48 475 448 923 (404)
HongKong .............. 216 76 99 216 607 — 607 (512)
Singapore ............... 209 7 45 209 470 — 470 130
Other Asia Pacific(8) ...... 46 88 43 248 425 170 595 49
Total Asia Pacific .... 1,723 989 774 4,539 8,025 720 8,745 2,430
Latin America
Brazil .................. 1,008 187 — 44 1,239 2,232 3,471 (79)
Mexico.................. 821 176 58 2,271 3,326 — 3,326 460
Chile ................... 236 19 — 8 263 717 980 (200)
Argentina ............... 68 24 — 102 194 — 194 (197)
Other Latin America(8) .... 126 134 7 84 351 8 359 (716)
Total Latin
America ............ 2,259 540 65 2,509 5,373 2,957 8,330 (732)
Central and Eastern
Europe(8) ............. 26 42 9 65 142 — 142 (99)
Total ............... $4,008 $1,571 $848 $7,113 $13,540 $3,677 $17,217 $1,599
(1) There is no generally accepted definition of emerging markets. The definition that we use includes all countries in Latin America
excluding Cayman Islands and Bermuda; all countries in Asia Pacific excluding Japan, Australia and New Zealand; and all
countries in Central and Eastern Europe excluding Greece.
(2) Includes acceptances, SBLCs, commercial letters of credit and formal guarantees.
(3) Derivative assets are reported on a mark-to-market basis and have not been reduced by the amount of collateral applied. Derivative
asset collateral totaled $58 million and $361 million at December 31, 2005 and 2004.
(4) Generally, cross-border resale agreements are presented based on the domicile of the counterparty because the counterparty has
the legal obligation for repayment except where the underlying securities are U.S. Treasuries, in which case the domicile is the
U.S., and therefore, excluded from this presentation. For regulatory reporting under FFIEC guidelines, cross-border resale
agreements are presented based on the domicile of the issuer of the securities that are held as collateral.
(5) Cross-border exposure includes amounts payable to us by borrowers or counterparties with a country of residence other than the
one in which the credit is booked, regardless of the currency in which the claim is denominated, consistent with FFIEC reporting
rules.
(6) Local country exposure includes amounts payable to us by borrowers with a country of residence in which the credit is booked,
regardless of the currency in which the claim is denominated. Management subtracts local funding or liabilities from local
exposures as allowed by the FFIEC. Total amount of available local liabilities funding local country exposure at December 31, 2005
was $24.2 billion compared to $17.2 billion at December 31, 2004. Local liabilities at December 31, 2005 in Asia Pacific and Latin
America were $13.6 billion and $10.6 billion of which $8.4 billion were in Hong Kong, $5.3 billion in Brazil, $3.1 billion in
Singapore, $1.7 billion in Argentina, $1.6 billion in Chile, $1.2 billion in Mexico, $782 million in India and $718 million in Uruguay.
There were no other countries with available local liabilities funding local country exposure greater than $500 million.
(7) Securities/Other Investments includes equity investment of $3.0 billion in CCB.
(8) Other Asia Pacific, Other Latin America, and Central and Eastern Europe include countries each with total foreign exposure of less
than $300 million.
58