Bank of America 2005 Annual Report Download - page 73
Download and view the complete annual report
Please find page 73 of the 2005 Bank of America annual report below. You can navigate through the pages in the report by either clicking on the pages listed below, or by using the keyword search tool below to find specific information within the annual report.-
 1
1 -
2
-
3
-
4
-
5
-
6
-
7
-
8
-
9
-
10
-
11
-
12
-
13
-
14
-
15
-
16
-
17
-
18
-
19
-
20
-
21
-
22
-
23
-
24
-
25
-
26
-
27
-
28
-
29
-
30
-
31
-
32
-
33
-
34
-
35
-
36
-
37
-
38
-
39
-
40
-
41
-
42
-
43
-
44
-
45
-
46
-
47
-
48
-
49
-
50
-
51
-
52
-
53
-
54
-
55
-
56
-
57
-
58
-
59
-
60
-
61
-
62
-
 63
63 -
 64
64 -
 65
65 -
 66
66 -
 67
67 -
 68
68 -
 69
69 -
 70
70 -
 71
71 -
 72
72 -
 73
73 -
 74
74 -
 75
75 -
 76
76 -
 77
77 -
 78
78 -
 79
79 -
 80
80 -
 81
81 -
 82
82 -
 83
83 -
84
-
85
-
86
-
87
-
88
-
89
-
90
-
91
-
92
-
93
-
94
-
95
-
96
-
97
-
98
-
99
-
100
-
101
-
102
-
103
-
104
-
105
-
106
-
107
-
108
-
109
-
110
-
111
-
112
-
113
-
114
-
115
-
116
-
117
-
118
-
119
-
120
-
121
-
122
-
123
-
124
-
125
-
126
-
127
-
128
-
129
-
130
-
131
-
132
-
133
-
134
-
135
-
136
-
137
-
138
-
139
-
140
-
141
-
142
-
143
-
144
-
145
-
146
-
147
-
148
-
149
-
150
-
151
-
152
-
153
-
154
-
155
-
156
-
157
-
158
-
159
-
160
-
161
-
162
-
163
-
164
-
165
-
166
-
167
-
168
-
169
-
170
-
171
-
172
-
173
-
174
-
175
-
176
-
177
-
178
-
179
-
180
-
181
-
182
-
183
-
184
-
185
-
186
-
187
-
188
-
189
-
190
-
191
-
192
-
193
-
194
-
195
-
196
-
197
-
198
-
199
-
200
-
201
-
202
-
203
-
204
-
205
-
206
-
207
-
208
-
209
-
210
-
211
-
212
-
213
 |
 |

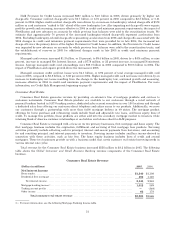
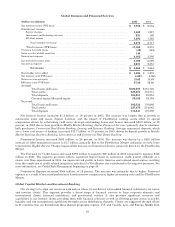
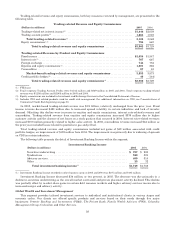
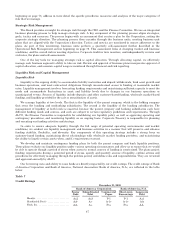
Global Capital Markets and Investment Banking
(Dollars in millions) 2005 2004
Net interest income (FTE basis):
Core net interest income ................................................ $ 1,854 $ 2,019
Trading-related net interest income ...................................... 1,444 2,039
Total net interest income ............................................ 3,298 4,058
Noninterest income:
Servicecharges ........................................................ 1,146 1,287
Investment and brokerage services ....................................... 806 705
Investment banking income ............................................. 1,749 1,783
Trading account profits ................................................. 1,664 1,023
Allotherincome ....................................................... 346 190
Total noninterest income ............................................ 5,711 4,988
Total revenue (FTE basis) .................................................. 9,009 9,046
Provision for credit losses ....................................................... (244) (445)
Gains (losses) on sales of debt securities .......................................... 117 (10)
Noninterest expense ........................................................... 6,678 6,581
Income before income taxes ..................................................... 2,692 2,900
Incometaxexpense ............................................................ 956 976
Net income .......................................................... $ 1,736 $ 1,924
Shareholder value added ....................................................... $ 642 $ 873
Net interest yield (FTE basis) ................................................... 0.92% 1.47%
Returnonaverageequity....................................................... 16.73 19.34
Efficiency ratio (FTE basis) ..................................................... 74.13 72.76
Average:
Totalloansandleases .................................................. $ 34,353 $ 33,891
Trading-related earning assets .......................................... 299,374 227,230
Total assets ........................................................... 410,979 321,743
Total deposits ......................................................... 84,979 74,738
Common equity/Allocated equity ......................................... 10,372 9,946
Period end:
Totalloansandleases .................................................. 40,213 33,387
Trading-related earning assets .......................................... 282,456 189,596
Total assets ........................................................... 395,900 303,897
Total deposits ......................................................... 86,144 76,986
Net Interest Income declined $760 million, or 19 percent, in 2005. Driving the decrease was lower trading-related
Net Interest Income of $595 million, or 29 percent. Despite the growth in average trading-related earning assets of $70.9
billion, or 33 percent, the contribution to Net Interest Income decreased due to a flattening yield curve. In 2005, core net
interest income decreased $165 million to $1.9 billion primarily due to spread compression. Average Deposits increased
$10.2 billion, or 14 percent, due to higher foreign deposits and escrow balances.
Noninterest Income increased $723 million, or 14 percent, in 2005. Driving the increase were higher Trading
Account Profits of $641 million, Equity Investment Gains (included in all other income) of $123 million and Investment
and Brokerage Services of $101 million. The increase in Trading Account Profits was due to growth in average trading-
related earning assets as a result of increased client activity as we continued to invest in the business. These increases
were partially offset by declines in Service Charges of $141 million due to effects of rising earnings credits on balances
required for services and lower Investment Banking Income of $34 million.
Provision for Credit Losses increased $201 million to negative $244 million in 2005, compared to negative $445
million in 2004, driven by a slower rate of improvement in commercial credit quality. Net charge-offs declined $245
million from the prior year, driven partially by increased recoveries. For more information, see Credit Risk Management
beginning on page 49.
Noninterest Expense remained relatively unchanged in 2005. Other general operating expense decreased primarily
due to the segment’s share of the mutual fund settlement and other litigation reserves recorded in 2004. This decrease
was offset by higher Personnel expense, including costs associated with the strategic initiative.
37