Bank of America 2005 Annual Report Download - page 71
Download and view the complete annual report
Please find page 71 of the 2005 Bank of America annual report below. You can navigate through the pages in the report by either clicking on the pages listed below, or by using the keyword search tool below to find specific information within the annual report.-
 1
1 -
2
-
3
-
4
-
5
-
6
-
7
-
8
-
9
-
10
-
11
-
12
-
13
-
14
-
15
-
16
-
17
-
18
-
19
-
20
-
21
-
22
-
23
-
24
-
25
-
26
-
27
-
28
-
29
-
30
-
31
-
32
-
33
-
34
-
35
-
36
-
37
-
38
-
39
-
40
-
41
-
42
-
43
-
44
-
45
-
46
-
47
-
48
-
49
-
50
-
51
-
52
-
53
-
54
-
55
-
56
-
57
-
58
-
59
-
60
-
 61
61 -
 62
62 -
 63
63 -
 64
64 -
 65
65 -
 66
66 -
 67
67 -
 68
68 -
 69
69 -
 70
70 -
 71
71 -
 72
72 -
 73
73 -
 74
74 -
 75
75 -
 76
76 -
 77
77 -
 78
78 -
 79
79 -
 80
80 -
 81
81 -
82
-
83
-
84
-
85
-
86
-
87
-
88
-
89
-
90
-
91
-
92
-
93
-
94
-
95
-
96
-
97
-
98
-
99
-
100
-
101
-
102
-
103
-
104
-
105
-
106
-
107
-
108
-
109
-
110
-
111
-
112
-
113
-
114
-
115
-
116
-
117
-
118
-
119
-
120
-
121
-
122
-
123
-
124
-
125
-
126
-
127
-
128
-
129
-
130
-
131
-
132
-
133
-
134
-
135
-
136
-
137
-
138
-
139
-
140
-
141
-
142
-
143
-
144
-
145
-
146
-
147
-
148
-
149
-
150
-
151
-
152
-
153
-
154
-
155
-
156
-
157
-
158
-
159
-
160
-
161
-
162
-
163
-
164
-
165
-
166
-
167
-
168
-
169
-
170
-
171
-
172
-
173
-
174
-
175
-
176
-
177
-
178
-
179
-
180
-
181
-
182
-
183
-
184
-
185
-
186
-
187
-
188
-
189
-
190
-
191
-
192
-
193
-
194
-
195
-
196
-
197
-
198
-
199
-
200
-
201
-
202
-
203
-
204
-
205
-
206
-
207
-
208
-
209
-
210
-
211
-
212
-
213
 |
 |

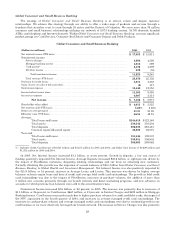
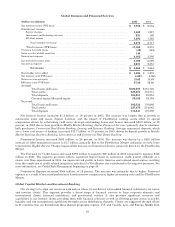
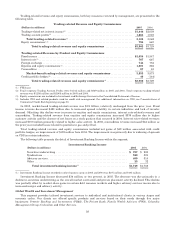
Global Business and Financial Services
(Dollars in millions) 2005 2004
Net interest income (FTE basis) ........................................................... $ 7,788 $ 6,534
Noninterest income:
Servicecharges...................................................................... 1,469 1,287
Investment and brokerage services ..................................................... 221 168
Allotherincome ..................................................................... 1,682 1,262
Total noninterest income ......................................................... 3,372 2,717
Total revenue (FTE basis) .................................................. 11,160 9,251
Provision for credit losses ................................................................. (49) (442)
Gains on sales of debt securities ........................................................... 146 —
Noninterest expense ..................................................................... 4,162 3,598
Income before income taxes ............................................................... 7,193 6,095
Income tax expense ...................................................................... 2,631 2,251
Net income .................................................................... $ 4,562 $ 3,844
Shareholder value added ................................................................. $ 1,486 $ 1,297
Net interest yield (FTE basis) ............................................................. 4.05% 4.06%
Return on average equity ................................................................. 15.63 15.89
Efficiency ratio (FTE basis) ............................................................... 37.29 38.90
Average:
Totalloansandleases .................................................. $180,557 $151,725
Total assets ........................................................... 222,584 184,771
Total deposits ......................................................... 106,951 93,254
Common equity/Allocated equity ......................................... 29,182 24,193
Year end:
Totalloansandleases .................................................. 192,532 170,698
Total assets ........................................................... 237,679 214,045
Total deposits ......................................................... 114,241 107,838
Net Interest Income increased $1.3 billion, or 19 percent in 2005. The increase was largely due to growth in
commercial loans and leases, deposit balances, and the impact of FleetBoston earning assets offset by spread
compression driven by a flattening yield curve. Average outstanding Loans and Leases increased $28.8 billion, or 19
percent, in 2005 due to loan growth in Middle Market Banking, Dealer Financial Services (primarily due to consumer
bulk purchases), Commercial Real Estate Banking, Leasing and Business Banking. Average commercial deposits, which
are a lower cost source of funding, increased $13.7 billion, or 15 percent, in 2005, driven by deposit growth in Middle
Market Banking, Business Banking, Latin America and Commercial Real Estate Banking.
Noninterest Income increased $655 million, or 24 percent, in 2005. The increase was driven by a $420 million
increase in other noninterest income to $1.7 billion, primarily due to the FleetBoston Merger and gains on early lease
terminations. Higher Service Charges impacted the increase in Noninterest Income, primarily driven by the FleetBoston
Merger.
The Provision for Credit Losses increased $393 million to negative $49 million in 2005 compared to negative $442
million in 2004. The negative provision reflects continued improvement in commercial credit quality although at a
slower rate than experienced in 2004. An improved risk profile in Latin America and reduced uncertainties resulting
from the completion of credit-related integration activities for FleetBoston also contributed to the negative provision. For
more information, see Credit Risk Management beginning on page 49.
Noninterest Expense increased $564 million, or 16 percent. The increase was primarily due to higher Personnel
expense as a result of increased performance based incentive compensation, higher processing costs and the FleetBoston
Merger.
Global Capital Markets and Investment Banking
Our strategy is to align our resources with sectors where we can deliver value-added financial solutions to our issuer
and investor clients. This segment provides a broad range of financial services to large corporate domestic and
international clients, financial institutions, and government entities. It also provides significant resources and
capabilities to our investor clients providing them with financial solutions as well as allowing greater access to market
liquidity and risk management capabilities through various distribution channels. Clients are supported through offices
in 27 countries that are divided into three distinct geographic regions: U.S. and Canada; Asia; and Europe, Middle East
35