Bank of America 2005 Annual Report Download - page 109
Download and view the complete annual report
Please find page 109 of the 2005 Bank of America annual report below. You can navigate through the pages in the report by either clicking on the pages listed below, or by using the keyword search tool below to find specific information within the annual report.-
 1
1 -
2
-
3
-
4
-
5
-
6
-
7
-
8
-
9
-
10
-
11
-
12
-
13
-
14
-
15
-
16
-
17
-
18
-
19
-
20
-
21
-
22
-
23
-
24
-
25
-
26
-
27
-
28
-
29
-
30
-
31
-
32
-
33
-
34
-
35
-
36
-
37
-
38
-
39
-
40
-
41
-
42
-
43
-
44
-
45
-
46
-
47
-
48
-
49
-
50
-
51
-
52
-
53
-
54
-
55
-
56
-
57
-
58
-
59
-
60
-
61
-
62
-
63
-
64
-
65
-
66
-
67
-
68
-
69
-
70
-
71
-
72
-
73
-
74
-
75
-
76
-
77
-
78
-
79
-
80
-
81
-
82
-
83
-
84
-
85
-
86
-
87
-
88
-
89
-
90
-
91
-
92
-
93
-
94
-
95
-
96
-
97
-
98
-
 99
99 -
 100
100 -
 101
101 -
 102
102 -
 103
103 -
 104
104 -
 105
105 -
 106
106 -
 107
107 -
 108
108 -
 109
109 -
 110
110 -
 111
111 -
 112
112 -
 113
113 -
 114
114 -
 115
115 -
 116
116 -
 117
117 -
 118
118 -
 119
119 -
120
-
121
-
122
-
123
-
124
-
125
-
126
-
127
-
128
-
129
-
130
-
131
-
132
-
133
-
134
-
135
-
136
-
137
-
138
-
139
-
140
-
141
-
142
-
143
-
144
-
145
-
146
-
147
-
148
-
149
-
150
-
151
-
152
-
153
-
154
-
155
-
156
-
157
-
158
-
159
-
160
-
161
-
162
-
163
-
164
-
165
-
166
-
167
-
168
-
169
-
170
-
171
-
172
-
173
-
174
-
175
-
176
-
177
-
178
-
179
-
180
-
181
-
182
-
183
-
184
-
185
-
186
-
187
-
188
-
189
-
190
-
191
-
192
-
193
-
194
-
195
-
196
-
197
-
198
-
199
-
200
-
201
-
202
-
203
-
204
-
205
-
206
-
207
-
208
-
209
-
210
-
211
-
212
-
213
 |
 |
The Corporation uses interest rate and foreign exchange rate derivative instruments to hedge the variability in the
cash flows of its variable rate assets and liabilities, and other forecasted transactions (cash flow hedges). The net losses
on both open and closed derivative instruments recorded in Accumulated OCI net-of-tax at December 31, 2005 was $(4.3)
billion. These net losses are expected to be reclassified into earnings in the same period when the hedged item affects
earnings and will decrease income or increase expense on the respective hedged items. Assuming no change in open cash
flow derivative hedge positions and no changes to interest and foreign exchange rates beyond what is implied in forward
yield curves at December 31, 2005, the net losses are expected to be reclassified into earnings as follows: 9 percent
within the next year, 57 percent within five years, 82 percent within 10 years, with the remaining 18 percent thereafter.
For more information on derivatives designated as cash flow hedges, see Note 5 of the Consolidated Financial
Statements.
The amount included in Accumulated OCI for terminated derivative contracts was a loss of $2.5 billion and a gain of
$143 million, net-of-tax, at December 31, 2005 and 2004. The decrease was due primarily to the termination of derivative
contracts with previously unrealized losses caused by interest rate fluctuations.
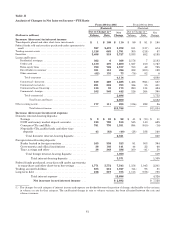
Mortgage Banking Risk Management
Interest rate lock commitments (IRLCs) on loans intended to be sold are subject to interest rate risk between the
date of the IRLC and the date the loan is funded. Loans held-for-sale are subject to interest rate risk from the date of
funding until the loans are sold to the secondary market. To hedge interest rate risk, we utilize forward loan sale
commitments and other derivative instruments including purchased options. These instruments are used either as an
economic hedge of IRLCs and loans held-for-sale, or designated as a cash flow hedge of loans held-for-sale, in which case
their net-of-tax unrealized gains and losses are included in Accumulated OCI. At December 31, 2005, the notional
amount of derivatives hedging the IRLCs and loans held-for-sale was $26.9 billion. The related net-of-tax unrealized loss
on the derivatives designated as cash flow hedges included in Accumulated OCI at December 31, 2005 was $3 million.
The notional amount of the IRLCs adjusted for fallout in the pipeline at December 31, 2005 was $4.3 billion. The amount
of loans held-for-sale at December 31, 2005 was $6.1 billion.
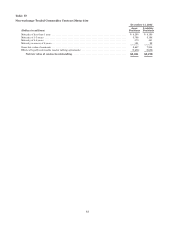
We manage changes in the value of MSRs by entering into derivative financial instruments and by purchasing and
selling securities. MSRs are an intangible asset created when the underlying mortgage loan is sold to investors and we
retain the right to service the loan. As of December 31, 2005, the MSR balance in Consumer Real Estate was $2.7 billion,
or 13 percent higher than December 31, 2004. For more information on Consumer Real Estate MSRs, refer to page 31.
We designate certain derivatives such as purchased options and interest rate swaps as fair value hedges of specified
MSRs under SFAS 133. At December 31, 2005, the amount of MSRs identified as being hedged by derivatives in
accordance with SFAS 133 was approximately $2.3 billion. The notional amount of the derivative contracts designated as
SFAS 133 hedges of MSRs at December 31, 2005 was $33.7 billion. The changes in the fair values of the derivative
contracts are substantially offset by changes in the fair values of the MSRs that are hedged by these derivative
contracts. During 2005, the change in value attributed to SFAS 133 hedged MSRs was $291 million, offset by derivative
hedge losses of $124 million.
In addition, we hold additional derivatives and certain securities (i.e. mortgage-backed securities) as economic
hedges of MSRs, which are not designated as SFAS 133 accounting hedges. During 2005, Interest Income from securities
used as an economic hedge of MSRs of $18 million was recognized. At December 31, 2005, the amount of MSRs covered
by such economic hedges was $250 million. At December 31, 2005, the unrealized loss on AFS Securities held as
economic hedges of MSRs was $29 million compared to an unrealized gain of $21 million on December 31, 2004.
See Notes 1 and 9 of the Consolidated Financial Statements for additional information.
Operational Risk Management
Operational risk is the risk of loss resulting from inadequate or failed internal processes, people and systems,
including system conversions and integration, and external events. Successful operational risk management is
particularly important to a diversified financial services company like ours because of the very nature, volume and
complexity of our various businesses.
In keeping with our management governance structure, the lines of business are responsible for all the risks within
the business including operational risks. Such risks are managed through corporate-wide or line of business specific
policies and procedures, controls, and monitoring tools. Examples of these include personnel management practices, data
reconciliation processes, fraud management units, transaction processing monitoring and analysis, business recovery
planning, and new product introduction processes.
We approach operational risk from two perspectives, enterprise-wide and line of business-specific. The Compliance
and Operational Risk Committee, chartered in 2005 as a subcommittee of the Finance Committee, provides consistent
communication and oversight of significant operational and compliance issues and oversees the adoption of best
practices. Two groups within Risk Management, Compliance Risk Management and Enterprise Operational Risk
73