Bank of America 2005 Annual Report Download - page 122
Download and view the complete annual report
Please find page 122 of the 2005 Bank of America annual report below. You can navigate through the pages in the report by either clicking on the pages listed below, or by using the keyword search tool below to find specific information within the annual report.-
 1
1 -
2
-
3
-
4
-
5
-
6
-
7
-
8
-
9
-
10
-
11
-
12
-
13
-
14
-
15
-
16
-
17
-
18
-
19
-
20
-
21
-
22
-
23
-
24
-
25
-
26
-
27
-
28
-
29
-
30
-
31
-
32
-
33
-
34
-
35
-
36
-
37
-
38
-
39
-
40
-
41
-
42
-
43
-
44
-
45
-
46
-
47
-
48
-
49
-
50
-
51
-
52
-
53
-
54
-
55
-
56
-
57
-
58
-
59
-
60
-
61
-
62
-
63
-
64
-
65
-
66
-
67
-
68
-
69
-
70
-
71
-
72
-
73
-
74
-
75
-
76
-
77
-
78
-
79
-
80
-
81
-
82
-
83
-
84
-
85
-
86
-
87
-
88
-
89
-
90
-
91
-
92
-
93
-
94
-
95
-
96
-
97
-
98
-
99
-
100
-
101
-
102
-
103
-
104
-
105
-
106
-
107
-
108
-
109
-
110
-
111
-
 112
112 -
 113
113 -
 114
114 -
 115
115 -
 116
116 -
 117
117 -
 118
118 -
 119
119 -
 120
120 -
 121
121 -
 122
122 -
 123
123 -
 124
124 -
 125
125 -
 126
126 -
 127
127 -
 128
128 -
 129
129 -
 130
130 -
 131
131 -
 132
132 -
133
-
134
-
135
-
136
-
137
-
138
-
139
-
140
-
141
-
142
-
143
-
144
-
145
-
146
-
147
-
148
-
149
-
150
-
151
-
152
-
153
-
154
-
155
-
156
-
157
-
158
-
159
-
160
-
161
-
162
-
163
-
164
-
165
-
166
-
167
-
168
-
169
-
170
-
171
-
172
-
173
-
174
-
175
-
176
-
177
-
178
-
179
-
180
-
181
-
182
-
183
-
184
-
185
-
186
-
187
-
188
-
189
-
190
-
191
-
192
-
193
-
194
-
195
-
196
-
197
-
198
-
199
-
200
-
201
-
202
-
203
-
204
-
205
-
206
-
207
-
208
-
209
-
210
-
211
-
212
-
213
 |
 |

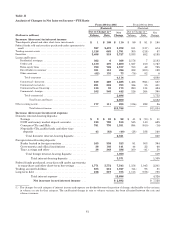
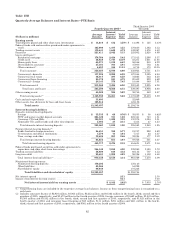
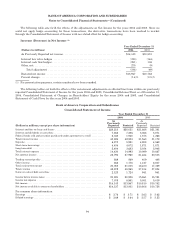
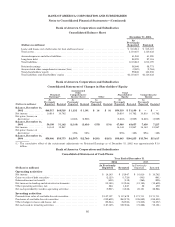
Second Quarter 2005
(Restated) First Quarter 2005
(Restated) Fourth Quarter 2004
(Restated)
(Dollars in millions) Average
Balance
Interest
Income/
Expense Yield/
Rate
Interest
Average
Balance Income/
Expense Yield/
Rate Average
Balance
Interest
Income/
Expense Yield/
Rate
Earning assets
Time deposits placed and other short-term
investments ............................... $ 13,696 $ 113 3.31%$ 14,327 $ 101 2.87%$ 15,620 $ 128 3.24%
Federal funds sold and securities purchased
under agreements to resell .................. 185,835 1,249 2.69 147,855 904 2.46 149,226 699 1.87
Trading account assets ....................... 134,196 1,454 4.34 117,748 1,203 4.10 110,585 1,067 3.85
Securities ................................... 227,182 2,825 4.98 204,574 2,559 5.01 171,173 2,082 4.86
Loans and leases(1):
Residential mortgage ....................... 167,263 2,285 5.47 178,075 2,415 5.44 178,853 2,447 5.46
Creditcard ............................... 52,474 1,481 11.32 51,310 1,373 10.85 49,366 1,351 10.88
Homeequitylines ......................... 54,941 799 5.83 51,477 692 5.45 48,336 609 5.01
Direct/Indirect consumer ................... 43,132 612 5.69 41,620 573 5.58 39,526 551 5.55
Other consumer(2) .......................... 6,968 155 8.96 7,305 158 8.75 7,557 153 8.07
Total consumer .......................... 324,778 5,332 6.58 329,787 5,211 6.38 323,638 5,111 6.29
Commercial—domestic ..................... 123,927 1,938 6.27 123,803 1,954 6.40 121,412 1,883 6.17
Commercial real estate ..................... 33,484 477 5.72 33,016 430 5.29 31,355 392 4.98
Commercial lease financing ................. 20,446 252 4.93 20,745 260 5.01 20,204 254 5.01
Commercial—foreign ....................... 17,780 306 6.90 17,570 259 5.97 18,828 272 5.76
Total commercial ........................ 195,637 2,973 6.09 195,134 2,903 6.03 191,799 2,801 5.81
Total loans and leases .................. 520,415 8,305 6.40 524,921 8,114 6.25 515,437 7,912 6.12
Other earning assets ......................... 37,194 512 5.52 35,466 455 5.19 35,937 457 5.08
Total earning assets(3) .................... 1,118,518 14,458 5.18 1,044,891 13,336 5.14 997,978 12,345 4.93
Cash and cash equivalents .................... 34,731 31,382 31,028
Other assets, less allowance for loan and lease
losses .................................... 124,229 124,586 123,518
Total assets ........................ $1,277,478 $1,200,859 $1,152,524
Interest-bearing liabilities
Domestic interest-bearing deposits:
Savings .................................. $ 38,043 $ 52 0.54%$ 37,000 $ 35 0.39%$ 36,927 $ 36 0.39%
NOW and money market deposit accounts .... 229,174 723 1.27 233,392 651 1.13 234,596 589 1.00
Consumer CDs and IRAs ................... 127,169 1,004 3.17 118,989 965 3.29 109,243 721 2.63
Negotiable CDs, public funds and other time
deposits ................................ 7,751 82 4.22 10,291 95 3.73 7,563 81 4.27
Total domestic interest-bearing deposits .... 402,137 1,861 1.86 399,672 1,746 1.77 388,329 1,427 1.46
Foreign interest-bearing deposits(4):
Banks located in foreign countries ........... 25,546 294 4.61 22,085 260 4.77 17,953 200 4.43
Governments and official institutions ......... 7,936 59 2.97 6,831 43 2.58 5,843 33 2.21
Time, savings and other .................... 30,973 149 1.94 30,770 133 1.75 30,459 104 1.36
Total foreign interest-bearing deposits ...... 64,455 502 3.13 59,686 436 2.96 54,255 337 2.47
Total interest-bearing deposits ........... 466,592 2,363 2.03 459,358 2,182 1.93 442,584 1,764 1.59
Federal funds purchased, securities sold under
agreements to repurchase and other short-term
borrowings................................ 323,916 2,582 3.20 276,483 1,988 2.91 252,413 1,452 2.29
Trading account liabilities .................... 60,987 611 4.02 44,507 427 3.89 37,387 352 3.74
Long-term debt .............................. 96,697 1,074 4.45 96,167 1,033 4.30 98,556 1,020 4.14
Total interest-bearing liabilities(3) ............ 948,192 6,630 2.80 876,515 5,630 2.60 830,940 4,588 2.20
Noninterest-bearing sources:
Noninterest-bearing deposits ................ 174,001 168,062 167,352
Other liabilities ........................... 56,456 56,881 55,509
Shareholders’ equity ....................... 98,829 99,401 98,723
Total liabilities and shareholders’
equity ........................... $1,277,478 $1,200,859 $1,152,524
Netinterestspread .......................... 2.38 2.54 2.73
Impact of noninterest-bearing sources .......... 0.42 0.42 0.37
Net interest income/yield on
earning assets .................... $ 7,828 2.80% $ 7,706 2.96% $7,757 3.10%
(3) Interest income includes the impact of interest rate risk management contracts, which increased interest income on the underlying
assets $29 million, $86 million, $168 million and $421 million in the fourth, third, second and first quarters of 2005, respectively,
and $439 million in the fourth quarter of 2004. Interest expense includes the impact of interest rate risk management contracts,
which increased interest expense on the underlying liabilities $254 million, $274 million, $303 million and $504 million in the
fourth, third, second and first quarters of 2005, respectively, and $295 million in the fourth quarter of 2004. For further information
on interest rate contracts, see “Interest Rate Risk Management” beginning on page 69.
(4) Primarily consists of time deposits in denominations of $100,000 or more.
(5) The Corporation provided unaudited financial information relating to the fourth quarter of 2005 in its current report on Form 8-K
filed on January 23, 2006.
86