Bank of America 2005 Annual Report Download - page 55
Download and view the complete annual report
Please find page 55 of the 2005 Bank of America annual report below. You can navigate through the pages in the report by either clicking on the pages listed below, or by using the keyword search tool below to find specific information within the annual report.-
 1
1 -
2
-
3
-
4
-
5
-
6
-
7
-
8
-
9
-
10
-
11
-
12
-
13
-
14
-
15
-
16
-
17
-
18
-
19
-
20
-
21
-
22
-
23
-
24
-
25
-
26
-
27
-
28
-
29
-
30
-
31
-
32
-
33
-
34
-
35
-
36
-
37
-
38
-
39
-
40
-
41
-
42
-
43
-
44
-
 45
45 -
 46
46 -
 47
47 -
 48
48 -
 49
49 -
 50
50 -
 51
51 -
 52
52 -
 53
53 -
 54
54 -
 55
55 -
 56
56 -
 57
57 -
 58
58 -
 59
59 -
 60
60 -
 61
61 -
 62
62 -
 63
63 -
 64
64 -
 65
65 -
66
-
67
-
68
-
69
-
70
-
71
-
72
-
73
-
74
-
75
-
76
-
77
-
78
-
79
-
80
-
81
-
82
-
83
-
84
-
85
-
86
-
87
-
88
-
89
-
90
-
91
-
92
-
93
-
94
-
95
-
96
-
97
-
98
-
99
-
100
-
101
-
102
-
103
-
104
-
105
-
106
-
107
-
108
-
109
-
110
-
111
-
112
-
113
-
114
-
115
-
116
-
117
-
118
-
119
-
120
-
121
-
122
-
123
-
124
-
125
-
126
-
127
-
128
-
129
-
130
-
131
-
132
-
133
-
134
-
135
-
136
-
137
-
138
-
139
-
140
-
141
-
142
-
143
-
144
-
145
-
146
-
147
-
148
-
149
-
150
-
151
-
152
-
153
-
154
-
155
-
156
-
157
-
158
-
159
-
160
-
161
-
162
-
163
-
164
-
165
-
166
-
167
-
168
-
169
-
170
-
171
-
172
-
173
-
174
-
175
-
176
-
177
-
178
-
179
-
180
-
181
-
182
-
183
-
184
-
185
-
186
-
187
-
188
-
189
-
190
-
191
-
192
-
193
-
194
-
195
-
196
-
197
-
198
-
199
-
200
-
201
-
202
-
203
-
204
-
205
-
206
-
207
-
208
-
209
-
210
-
211
-
212
-
213
 |
 |

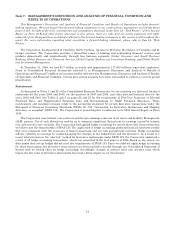
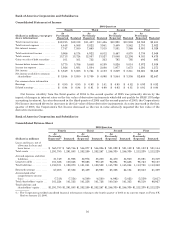
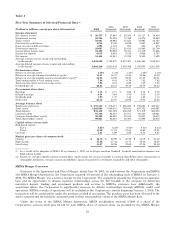
Financial Highlights
Net Interest Income
Net Interest Income on a FTE basis increased $2.9 billion to $31.6 billion in 2005 compared to 2004. The primary
drivers of the increase were the FleetBoston Merger, organic growth in consumer (primarily credit card and home
equity) and commercial loans, higher domestic deposit levels and a larger ALM portfolio (primarily securities). Partially
offsetting these increases was the adverse impact of spread compression due to the flattening of the yield curve, which
contributed to lower Net Interest Income. The net interest yield on a FTE basis declined 33 basis points (bps) to 2.84
percent in 2005. This was primarily due to the adverse impact of an increase in lower-yielding, trading-related balances
and spread compression, which was partially offset by growth in core deposit and consumer loans. For more information
on Net Interest Income on a FTE basis, see Table I on page 80.
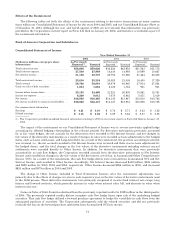
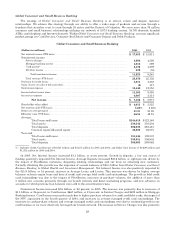
Noninterest Income
Noninterest Income
(Dollars in millions) 2005 2004
(Restated)
Servicecharges ........................................................ $ 7,704 $ 6,989
Investment and brokerage services ....................................... 4,184 3,614
Mortgage banking income ............................................... 805 414
Investment banking income ............................................. 1,856 1,886
Equity investment gains ................................................ 2,040 863
Cardincome .......................................................... 5,753 4,592
Trading account profits ................................................. 1,812 869
Otherincome.......................................................... 1,200 1,778
Total noninterest income ......................................... $25,354 $21,005
Noninterest Income increased $4.3 billion to $25.4 billion for 2005 compared to 2004, due to the following which
includes the impact of FleetBoston:
• Service Charges grew $715 million driven by organic account growth.
• Investment and Brokerage Services increased $570 million due to increases in asset management fees and mutual
fund fees.
• Mortgage Banking Income increased $391 million due to lower MSR impairment charges which were partially
offset by lower production income.
• Equity Investment Gains increased $1.2 billion, primarily in Principal Investing, as liquidity in the private equity
markets increased.
• Card Income increased $1.2 billion due to increased interchange income and merchant discount fees driven by
growth in debit and credit purchase volumes and the acquisition of NPC.
• Trading Account Profits increased $943 million due to increased customer activity driven by our strategic
initiative in Global Capital Markets and Investment Banking to expand business capabilities and opportunities,
and the absence of a writedown of the Excess Spread Certificates (the Certificates) that occurred in the prior year.
For more information on the Certificates, see Note 1 of the Consolidated Financial Statements.
• Other Income decreased $578 million primarily related to losses on derivative instruments used as economic
hedges in the ALM process that did not qualify for SFAS 133 hedge accounting.
Provision for Credit Losses
The Provision for Credit Losses increased $1.2 billion to $4.0 billion in 2005 with credit card being the primary
driver of the increase. Consumer credit card net charge-offs increased $1.3 billion from 2004 to $3.7 billion with an
estimated $578 million related to the increase in bankruptcy filings prior to the effective date of the new bankruptcy
legislation enacted in the fourth quarter of 2005. We estimate that approximately 70 percent of these bankruptcy-related
charge-offs represent acceleration from 2006 and were provided for previously. Also impacting credit card net charge-offs
and the Provision for Credit Losses were organic growth and seasoning of the portfolio, the impact of the FleetBoston
portfolio and new advances on accounts for which previous loan balances were sold to the securitization trusts. The
provision also increased as the rate of credit quality improvement slowed in the commercial portfolio and a $50 million
reserve was established for estimated losses associated with Hurricane Katrina. Partially offsetting these increases was
a reduction in the reserves of $250 million due to reduced uncertainties resulting from the completion of credit-related
integration activities for FleetBoston.
19