Bank of America 2005 Annual Report Download - page 105
Download and view the complete annual report
Please find page 105 of the 2005 Bank of America annual report below. You can navigate through the pages in the report by either clicking on the pages listed below, or by using the keyword search tool below to find specific information within the annual report.-
 1
1 -
2
-
3
-
4
-
5
-
6
-
7
-
8
-
9
-
10
-
11
-
12
-
13
-
14
-
15
-
16
-
17
-
18
-
19
-
20
-
21
-
22
-
23
-
24
-
25
-
26
-
27
-
28
-
29
-
30
-
31
-
32
-
33
-
34
-
35
-
36
-
37
-
38
-
39
-
40
-
41
-
42
-
43
-
44
-
45
-
46
-
47
-
48
-
49
-
50
-
51
-
52
-
53
-
54
-
55
-
56
-
57
-
58
-
59
-
60
-
61
-
62
-
63
-
64
-
65
-
66
-
67
-
68
-
69
-
70
-
71
-
72
-
73
-
74
-
75
-
76
-
77
-
78
-
79
-
80
-
81
-
82
-
83
-
84
-
85
-
86
-
87
-
88
-
89
-
90
-
91
-
92
-
93
-
94
-
 95
95 -
 96
96 -
 97
97 -
 98
98 -
 99
99 -
 100
100 -
 101
101 -
 102
102 -
 103
103 -
 104
104 -
 105
105 -
 106
106 -
 107
107 -
 108
108 -
 109
109 -
 110
110 -
 111
111 -
 112
112 -
 113
113 -
 114
114 -
 115
115 -
116
-
117
-
118
-
119
-
120
-
121
-
122
-
123
-
124
-
125
-
126
-
127
-
128
-
129
-
130
-
131
-
132
-
133
-
134
-
135
-
136
-
137
-
138
-
139
-
140
-
141
-
142
-
143
-
144
-
145
-
146
-
147
-
148
-
149
-
150
-
151
-
152
-
153
-
154
-
155
-
156
-
157
-
158
-
159
-
160
-
161
-
162
-
163
-
164
-
165
-
166
-
167
-
168
-
169
-
170
-
171
-
172
-
173
-
174
-
175
-
176
-
177
-
178
-
179
-
180
-
181
-
182
-
183
-
184
-
185
-
186
-
187
-
188
-
189
-
190
-
191
-
192
-
193
-
194
-
195
-
196
-
197
-
198
-
199
-
200
-
201
-
202
-
203
-
204
-
205
-
206
-
207
-
208
-
209
-
210
-
211
-
212
-
213
 |
 |

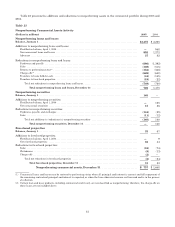
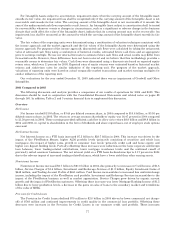
Table 26 presents average, high and low daily VAR for 2005 and 2004.
Table 26
Trading Activities Market Risk
Twelve Months Ended December 31
2005 2004
VAR VAR
(Dollars in millions) Average High(1) Low(1) Average High(1) Low(1)
Foreign exchange ........................................... $ 5.6 $12.1 $ 2.6 $ 3.6 $ 8.1 $ 1.4
Interest rate ............................................... 24.7 58.2 10.8 26.2 51.5 10.7
Credit(2) ................................................... 55.4 77.3 35.9 35.7 61.4 21.9
Real estate/mortgage(3) ...................................... 11.4 20.7 6.5 10.5 26.0 4.6
Equities ................................................... 18.1 35.1 9.6 21.8 51.5 7.9
Commodities ............................................... 6.6 10.6 3.5 6.5 10.2 3.8
Portfolio diversification ...................................... (59.6) — — (56.3) — —
Total trading portfolio ................................ $ 62.2 $92.4 $38.0 $ 48.0 $78.5 $29.4
Total market-based trading portfolio(4) ..................... $ 40.7 $66.4 $26.4 $ 44.1 $79.0 $23.7
(1) The high and low for the total portfolio may not equal the sum of the individual components as the highs or lows of the individual
portfolios may have occurred on different trading days.
(2) Credit includes credit fixed income and CDS used for credit risk management. Average VAR for CDS was $69.0 million and $23.5
million in 2005 and 2004. In 2005, the Credit VAR was less than VAR for CDS used for credit risk management as the positions in
credit fixed income typically offset the risk of CDS. The relationship between overall Credit VAR and the VAR for CDS can change
over time as a result of changes in the relative sizes of the credit fixed income and CDS exposures.
(3) Real estate/mortgage includes capital market real estate and the Certificates. Effective June 1, 2004, Real estate/mortgage no
longer includes the Certificates. For additional information on the Certificates, see Note 1 of the Consolidated Financial
Statements.
(4) Total market-based trading portfolio excludes CDS used for credit risk management, net of the effect of diversification.
The increase in average VAR of the trading portfolio for 2005 was primarily due to increases in the average risk
taken in credit due to an increase in credit protection purchased to hedge the credit risk in our commercial loan portfolio.
Stress Testing
Because the very nature of a VAR model suggests results can exceed our estimates, we “stress test” our portfolio.
Stress testing estimates the value change in our trading portfolio due to abnormal market movements. Various stress
scenarios are run regularly against the trading portfolio to verify that, even under extreme market moves, we will
preserve our capital; to determine the effects of significant historical events; and to determine the effects of specific,
extreme hypothetical, but plausible events. The results of the stress scenarios are calculated daily and reported to senior
management as part of the regular reporting process. The results of certain specific, extreme hypothetical scenarios are
presented to the Asset and Liability Committee.
Interest Rate Risk Management
Interest rate risk represents the most significant market risk exposure to our nontrading financial instruments. Our
overall goal is to manage interest rate risk so that movements in interest rates do not adversely affect Net Interest
Income. Interest rate risk is measured as the potential volatility in our Net Interest Income caused by changes in market
interest rates. Client facing activities, primarily lending and deposit-taking, create interest rate sensitive positions on
our balance sheet. Interest rate risk from these activities as well as the impact of changing market conditions is
managed through the ALM process.
Sensitivity simulations are used to estimate the impact on Net Interest Income of numerous interest rate scenarios,
balance sheet trends and strategies. These simulations estimate levels of short-term financial instruments, debt
securities, loans, deposits, borrowings and derivative instruments. In addition, these simulations incorporate
assumptions about balance sheet dynamics such as loan and deposit growth and pricing, changes in funding mix, and
asset and liability repricing and maturity characteristics. In addition to Net Interest Income sensitivity simulations,
market value sensitivity measures are also utilized.
The Balance Sheet Management group maintains a Net Interest Income forecast utilizing different rate scenarios,
with the base case utilizing the forward market curve. The Balance Sheet Management group constantly updates the
Net Interest Income forecast for changing assumptions and differing outlooks based on economic trends and market
conditions. Thus, we continually monitor our balance sheet position in an effort to maintain an acceptable level of
exposure to volatile interest rate changes.
69