Bank of America 2005 Annual Report Download - page 89
Download and view the complete annual report
Please find page 89 of the 2005 Bank of America annual report below. You can navigate through the pages in the report by either clicking on the pages listed below, or by using the keyword search tool below to find specific information within the annual report.-
 1
1 -
2
-
3
-
4
-
5
-
6
-
7
-
8
-
9
-
10
-
11
-
12
-
13
-
14
-
15
-
16
-
17
-
18
-
19
-
20
-
21
-
22
-
23
-
24
-
25
-
26
-
27
-
28
-
29
-
30
-
31
-
32
-
33
-
34
-
35
-
36
-
37
-
38
-
39
-
40
-
41
-
42
-
43
-
44
-
45
-
46
-
47
-
48
-
49
-
50
-
51
-
52
-
53
-
54
-
55
-
56
-
57
-
58
-
59
-
60
-
61
-
62
-
63
-
64
-
65
-
66
-
67
-
68
-
69
-
70
-
71
-
72
-
73
-
74
-
75
-
76
-
77
-
78
-
 79
79 -
 80
80 -
 81
81 -
 82
82 -
 83
83 -
 84
84 -
 85
85 -
 86
86 -
 87
87 -
 88
88 -
 89
89 -
 90
90 -
 91
91 -
 92
92 -
 93
93 -
 94
94 -
 95
95 -
 96
96 -
 97
97 -
 98
98 -
 99
99 -
100
-
101
-
102
-
103
-
104
-
105
-
106
-
107
-
108
-
109
-
110
-
111
-
112
-
113
-
114
-
115
-
116
-
117
-
118
-
119
-
120
-
121
-
122
-
123
-
124
-
125
-
126
-
127
-
128
-
129
-
130
-
131
-
132
-
133
-
134
-
135
-
136
-
137
-
138
-
139
-
140
-
141
-
142
-
143
-
144
-
145
-
146
-
147
-
148
-
149
-
150
-
151
-
152
-
153
-
154
-
155
-
156
-
157
-
158
-
159
-
160
-
161
-
162
-
163
-
164
-
165
-
166
-
167
-
168
-
169
-
170
-
171
-
172
-
173
-
174
-
175
-
176
-
177
-
178
-
179
-
180
-
181
-
182
-
183
-
184
-
185
-
186
-
187
-
188
-
189
-
190
-
191
-
192
-
193
-
194
-
195
-
196
-
197
-
198
-
199
-
200
-
201
-
202
-
203
-
204
-
205
-
206
-
207
-
208
-
209
-
210
-
211
-
212
-
213
 |
 |

On-balance sheet consumer loans and leases 90 days or more past due and still accruing interest totaled $1.3 billion
at December 31, 2005, and were up $131 million from December 31, 2004, primarily driven by a $122 million increase in
credit card past due loans due to continued seasoning and growth.
Commercial Portfolio Credit Risk Management
Credit risk management for the commercial portfolio begins with an assessment of the credit risk profile of the
borrower or counterparty based on an analysis of the borrower’s or counterparty’s financial position. As part of the
overall credit risk assessment of a borrower or counterparty, each commercial credit exposure or transaction is assigned
a risk rating and is subject to approval based on defined credit approval standards. Subsequent to loan origination, risk
ratings are monitored on an ongoing basis. If necessary, risk ratings are adjusted to reflect changes in the borrower’s or
counterparty’s financial condition, cash flow or financial situation. We use risk rating aggregations to measure and
evaluate concentrations within portfolios. Risk ratings are a factor in determining the level of assigned economic capital
and the allowance for credit losses. In making decisions regarding credit, we consider risk rating, collateral, country,
industry and single name concentration limits while also balancing the total borrower or counterparty relationship and
SVA.
Our lines of business and Risk Management personnel use a variety of tools to continuously monitor a borrower’s or
counterparty’s ability to perform under its obligations. Additionally, we utilize syndication of exposure to other entities,
loan sales and other risk mitigation techniques to manage the size and risk profile of the loan portfolio.
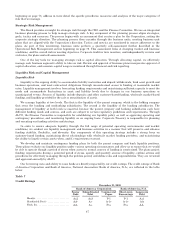
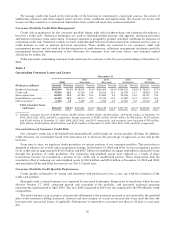
Table 12 presents outstanding commercial loans and leases for each year in the five-year period ending
December 31, 2005.
Table 12
Outstanding Commercial Loans and Leases
December 31
2005 2004 2003 2002 2001
(Dollars in millions) Amount Percent Amount Percent Amount Percent Amount Percent Amount Percent
Commercial—domestic ........ $140,533 64.3% $122,095 62.9% $ 91,491 69.7% $ 99,151 68.3% $110,981 67.7%
Commercial real estate(1) ...... 35,766 16.4 32,319 16.7 19,367 14.7 20,205 13.9 22,655 13.8
Commercial lease financing .... 20,705 9.5 21,115 10.9 9,692 7.4 10,386 7.2 11,404 7.0
Commercial—foreign ......... 21,330 9.8 18,401 9.5 10,754 8.2 15,428 10.6 18,858 11.5
Total commercial loans
and leases ............ $218,334 100.0% $193,930 100.0% $131,304 100.0% $145,170 100.0% $163,898 100.0%
(1) Includes domestic commercial real estate loans of $35,181 million, $31,879 million, $19,043 million, $19,910 million, and $22,272
million at December 31, 2005, 2004, 2003, 2002, and 2001, respectively; and foreign commercial real estate loans of $585 million,
$440 million, $324 million, $295 million, and $383 million at December 31, 2005, 2004, 2003, 2002, and 2001, respectively.
Concentrations of Commercial Credit Risk
Portfolio credit risk is evaluated and managed with a goal that concentrations of credit exposure do not result in
undesirable levels of risk. We review, measure, and manage concentrations of credit exposure by industry, product,
geography and customer relationship. Distribution of loans and leases by loan size is an additional measure of the
portfolio risk diversification. We also review, measure, and manage commercial real estate loans by geographic location
and property type. In addition, within our international portfolio, we evaluate borrowings by region and by country.
Tables 13 through 19 summarize these concentrations.
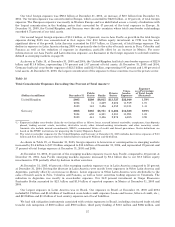
From the perspective of portfolio risk management, customer concentration management is most relevant in Global
Capital Markets and Investment Banking. Within that portfolio, concentrations are actively managed through the
underwriting and ongoing monitoring processes, the established strategy of “originate to distribute”, and partly through
the purchase of credit protection through credit derivatives. We utilize various risk mitigation tools to economically
hedge our risk to certain credit counterparties. Credit derivatives are financial instruments that we purchase for
protection against the deterioration of credit quality. Earnings volatility increases due to accounting asymmetry as we
mark to market the CDS, as required by SFAS 133, while the loans are recorded at historical cost less an allowance for
credit losses or, if held-for-sale, at the lower of cost or market.
53