Bank of America 2005 Annual Report Download - page 172
Download and view the complete annual report
Please find page 172 of the 2005 Bank of America annual report below. You can navigate through the pages in the report by either clicking on the pages listed below, or by using the keyword search tool below to find specific information within the annual report.-
 1
1 -
2
-
3
-
4
-
5
-
6
-
7
-
8
-
9
-
10
-
11
-
12
-
13
-
14
-
15
-
16
-
17
-
18
-
19
-
20
-
21
-
22
-
23
-
24
-
25
-
26
-
27
-
28
-
29
-
30
-
31
-
32
-
33
-
34
-
35
-
36
-
37
-
38
-
39
-
40
-
41
-
42
-
43
-
44
-
45
-
46
-
47
-
48
-
49
-
50
-
51
-
52
-
53
-
54
-
55
-
56
-
57
-
58
-
59
-
60
-
61
-
62
-
63
-
64
-
65
-
66
-
67
-
68
-
69
-
70
-
71
-
72
-
73
-
74
-
75
-
76
-
77
-
78
-
79
-
80
-
81
-
82
-
83
-
84
-
85
-
86
-
87
-
88
-
89
-
90
-
91
-
92
-
93
-
94
-
95
-
96
-
97
-
98
-
99
-
100
-
101
-
102
-
103
-
104
-
105
-
106
-
107
-
108
-
109
-
110
-
111
-
112
-
113
-
114
-
115
-
116
-
117
-
118
-
119
-
120
-
121
-
122
-
123
-
124
-
125
-
126
-
127
-
128
-
129
-
130
-
131
-
132
-
133
-
134
-
135
-
136
-
137
-
138
-
139
-
140
-
141
-
142
-
143
-
144
-
145
-
146
-
147
-
148
-
149
-
150
-
151
-
152
-
153
-
154
-
155
-
156
-
157
-
158
-
159
-
160
-
161
-
 162
162 -
 163
163 -
 164
164 -
 165
165 -
 166
166 -
 167
167 -
 168
168 -
 169
169 -
 170
170 -
 171
171 -
 172
172 -
 173
173 -
 174
174 -
 175
175 -
 176
176 -
 177
177 -
 178
178 -
 179
179 -
 180
180 -
 181
181 -
 182
182 -
183
-
184
-
185
-
186
-
187
-
188
-
189
-
190
-
191
-
192
-
193
-
194
-
195
-
196
-
197
-
198
-
199
-
200
-
201
-
202
-
203
-
204
-
205
-
206
-
207
-
208
-
209
-
210
-
211
-
212
-
213
 |
 |

BANK OF AMERICA CORPORATION AND SUBSIDIARIES
Notes to Consolidated Financial Statements—(Continued)
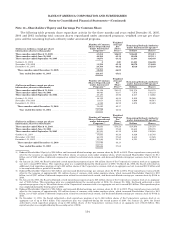
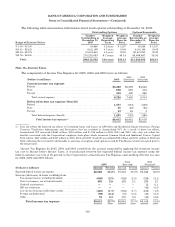
The calculation of earnings per common share and diluted earnings per common share for 2005, 2004
and 2003 is presented below. See Note 1 of the Consolidated Financial Statements for a discussion on the
calculation of earnings per common share.
(Dollars in millions, except per share information; shares in thousands) 2005 2004
(Restated) 2003
(Restated)
Earnings per common share
Netincome ...................................................................... $ 16,465 $ 13,947 $ 10,762
Preferred stock dividends ......................................................... (18) (16) (4)
Net income available to common shareholders ....................................... $ 16,447 $ 13,931 $ 10,758
Average common shares issued and outstanding ...................................... 4,008,688 3,758,507 2,973,407
Earnings per common share ................................................ $4.10$ 3.71 $ 3.62
Diluted earnings per common share
Net income available to common shareholders ....................................... $ 16,447 $ 13,931 $ 10,758
Convertible preferred stock dividends ............................................... —24
Net income available to common shareholders and assumed conversions ................. $ 16,447 $ 13,933 $ 10,762
Average common shares issued and outstanding ...................................... 4,008,688 3,758,507 2,973,407
Dilutive potential common shares(1, 2) ............................................... 59,452 65,436 56,949
Total diluted average common shares issued and outstanding .......................... 4,068,140 3,823,943 3,030,356
Diluted earnings per common share ......................................... $4.04$ 3.64 $ 3.55
(1) For 2005, 2004 and 2003, average options to purchase 39 million, 62 million and 34 million shares, respectively, were outstanding
but not included in the computation of earnings per common share because they were antidilutive.
(2) Includes incremental shares from assumed conversions of convertible preferred stock, restricted stock units, restricted stock shares
and stock options.
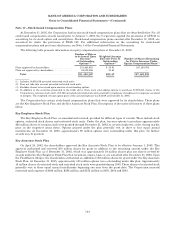
Effective for the third quarter dividend, the Board increased the quarterly cash dividend 11 percent from $0.45 to
$0.50 per common share. In October 2005, the Board declared a fourth quarter cash dividend which was paid on
December 23, 2005 to common shareholders of record on December 2, 2005. In January 2006, the Board declared a
quarterly cash dividend of $0.50 per common share payable on March 24, 2006 to shareholders of record on March 3,
2006.
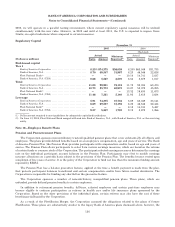
Note 15—Regulatory Requirements and Restrictions
The Board of Governors of the Federal Reserve System (FRB) requires the Corporation’s banking subsidiaries to
maintain reserve balances based on a percentage of certain deposits. Average daily reserve balances required by the
FRB were $6.4 billion and $6.3 billion for 2005 and 2004. Currency and coin residing in branches and cash vaults (vault
cash) are used to partially satisfy the reserve requirement. The average daily reserve balances, in excess of vault cash,
held with the Federal Reserve Bank amounted to $361 million and $627 million for 2005 and 2004.
The primary source of funds for cash distributions by the Corporation to its shareholders is dividends received from
its banking subsidiaries. Bank of America, N.A., Bank of America, N.A. (USA) and Fleet National Bank declared and
paid dividends of $7.4 billion, $1.9 billion and $750 million, respectively, for 2005 to the parent. On June 13, 2005, Fleet
National Bank merged with and into Bank of America, N.A., with Bank of America, N.A. as the surviving entity. In
2006, Bank of America, N.A. and Bank of America, N.A. (USA) can declare and pay dividends to the parent of $12.1
billion and $879 million plus an additional amount equal to its net profits for 2006, as defined by statute, up to the date
of any such dividend declaration. The other subsidiary national banks can initiate aggregate dividend payments in 2006
of $44 million plus an additional amount equal to their net profits for 2006, as defined by statute, up to the date of any
such dividend declaration. The amount of dividends that each subsidiary bank may declare in a calendar year without
approval by the OCC is the subsidiary bank’s net profits for that year combined with its net retained profits, as defined,
for the preceding two years.
The FRB, the OCC and the Federal Deposit Insurance Corporation (collectively, the Agencies) have issued
regulatory capital guidelines for U.S. banking organizations. Failure to meet the capital requirements can initiate
certain mandatory and discretionary actions by regulators that could have a material effect on the Corporation’s
financial statements. At December 31, 2005 and 2004, the Corporation, Bank of America, N.A. and Bank of America,
136