Bank of America 2005 Annual Report Download - page 108
Download and view the complete annual report
Please find page 108 of the 2005 Bank of America annual report below. You can navigate through the pages in the report by either clicking on the pages listed below, or by using the keyword search tool below to find specific information within the annual report.-
 1
1 -
2
-
3
-
4
-
5
-
6
-
7
-
8
-
9
-
10
-
11
-
12
-
13
-
14
-
15
-
16
-
17
-
18
-
19
-
20
-
21
-
22
-
23
-
24
-
25
-
26
-
27
-
28
-
29
-
30
-
31
-
32
-
33
-
34
-
35
-
36
-
37
-
38
-
39
-
40
-
41
-
42
-
43
-
44
-
45
-
46
-
47
-
48
-
49
-
50
-
51
-
52
-
53
-
54
-
55
-
56
-
57
-
58
-
59
-
60
-
61
-
62
-
63
-
64
-
65
-
66
-
67
-
68
-
69
-
70
-
71
-
72
-
73
-
74
-
75
-
76
-
77
-
78
-
79
-
80
-
81
-
82
-
83
-
84
-
85
-
86
-
87
-
88
-
89
-
90
-
91
-
92
-
93
-
94
-
95
-
96
-
97
-
 98
98 -
 99
99 -
 100
100 -
 101
101 -
 102
102 -
 103
103 -
 104
104 -
 105
105 -
 106
106 -
 107
107 -
 108
108 -
 109
109 -
 110
110 -
 111
111 -
 112
112 -
 113
113 -
 114
114 -
 115
115 -
 116
116 -
 117
117 -
 118
118 -
119
-
120
-
121
-
122
-
123
-
124
-
125
-
126
-
127
-
128
-
129
-
130
-
131
-
132
-
133
-
134
-
135
-
136
-
137
-
138
-
139
-
140
-
141
-
142
-
143
-
144
-
145
-
146
-
147
-
148
-
149
-
150
-
151
-
152
-
153
-
154
-
155
-
156
-
157
-
158
-
159
-
160
-
161
-
162
-
163
-
164
-
165
-
166
-
167
-
168
-
169
-
170
-
171
-
172
-
173
-
174
-
175
-
176
-
177
-
178
-
179
-
180
-
181
-
182
-
183
-
184
-
185
-
186
-
187
-
188
-
189
-
190
-
191
-
192
-
193
-
194
-
195
-
196
-
197
-
198
-
199
-
200
-
201
-
202
-
203
-
204
-
205
-
206
-
207
-
208
-
209
-
210
-
211
-
212
-
213
 |
 |

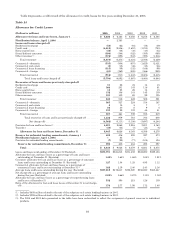
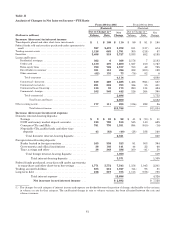
The following table includes derivatives utilized in our ALM process, including those designated as SFAS 133
hedges and those used as economic hedges that do not qualify for SFAS 133 hedge accounting treatment. The fair value
of net ALM contracts decreased from $3.4 billion at December 31, 2004 to $(386) million at December 31, 2005. The
decrease was attributable to decreases in the value of options, foreign exchange contracts and futures and forward rate
contracts, partially offset by increases in the value of interest rate swaps. The decrease in the value of options was due to
reduction in outstanding option positions due to terminations, maturities and decreases in the values of remaining open
options positions. The decrease in the value of foreign exchange contracts was due to the strengthening of the U.S. dollar
against most foreign currencies during 2005. The decrease in the value of futures and forward rate contracts was due to
the impact of increases in interest rates during 2005 on long futures and forward rate contracts.
Table 29
Asset and Liability Management Interest Rate and Foreign Exchange Contracts
December 31, 2005 Expected Maturity Average
Estimated
Duration
(Dollars in millions, average
estimated duration in years) Fair
Value Total 2006 2007 2008 2009 2010 Thereafter
Receive fixed interest rate
swaps(1) .................... $(1,390) 4.17
Notional amount ............ $108,985 $ 4,337 $ 13,080 $ 6,144 $39,107 $10,387 $35,930
Weighted average fixed
rate ..................... 4.62% 4.75% 4.66% 4.02% 4.51% 4.43% 4.77%
Pay fixed interest rate
swaps(1) .................... (408) 3.85
Notional amount ............ $102,281 $ 5,100 $ 55,925 $10,152 $ — $ — $31,104
Weighted average fixed
rate ..................... 4.61% 3.23% 4.46% 4.24% — % — % 5.21%
Basisswaps .................. (644)
Notional amount(3) .......... $ 17,806 $ 514 $ 174 $ 884 $ 2,839 $ 3,094 $10,301
Option products(2) ............. 1,349
Notional amount(3) .......... 57,246 — — 57,246 — — —
Foreign exchange contracts .... 909
Notional amount ............ 16,061 1,335 51 1,436 1,826 3,485 7,928
Futures and forward rate
contracts(4) ................. (202)
Notional amount(3) .......... 34,71634,716———— —
Net ALM contracts ...... $ (386)
December 31, 2004 Expected Maturity Average
Estimated
Duration
(Dollars in millions, average
estimated duration in years) Fair
Value Total 2005 2006 2007 2008 2009 Thereafter
Receive fixed interest rate
swaps(1) .................... $ (880) 4.43
Notional amount ............ $167,324 $ 2,580 $ 7,290 $ 23,598 $46,917 $25,601 $61,338
Weighted average fixed
rate ..................... 4.04% 4.78% 4.52% 3.11% 3.47% 3.83% 4.83%
Pay fixed interest rate
swaps(1) .................... (2,248) 4.77
Notional amount ............ $157,837 $ 39 $ 6,320 $62,584 $16,136 $ 10,289 $ 62,469
Weighted average fixed
rate ..................... 4.24% 5.01% 3.54% 3.58% 3.91% 3.85% 5.13%
Basisswaps .................. (4)
Notional amount(3) .......... $ 6,700 $ 500 $ 4,400 $ — $ — $ — $ 1,800
Option products(2) ............. 3,492
Notional amount(3) .......... 323,835 145,200 90,000 17,500 58,404 — 12,731
Foreign exchange contracts .... 2,748
Notional amount ............ 13,606 71 1,529 55 1,587 2,091 8,273
Futures and forward rate
contracts(4) ................. 287
Notional amount(3) .......... (10,889) 10,111 (21,000) — — — —
Net ALM contracts ...... $ 3,395
(1) At December 31, 2005, $46.6 billion of the receive fixed swap notional amount and $41.9 billion of the pay fixed swap notional
amount represented forward starting swaps that will not be effective until their respective contractual start dates. At December 31,
2004, $39.9 billion of the receive fixed swap notional amount and $75.9 billion of the pay fixed swap notional amount represented
forward starting swaps that will not be effective until their respective contractual start dates.
(2) Option products include caps, floors, swaptions and exchange-traded options on index futures contracts. These strategies may
include option collars or spread strategies, which involve the buying and selling of options on the same underlying security or
interest rate index.
(3) Reflects the net of long and short positions.
(4) Futures and forward rate contracts include Eurodollar futures, U.S. Treasury futures, and forward purchase and sale contracts.
72