Bank of America 2005 Annual Report Download - page 148
Download and view the complete annual report
Please find page 148 of the 2005 Bank of America annual report below. You can navigate through the pages in the report by either clicking on the pages listed below, or by using the keyword search tool below to find specific information within the annual report.-
 1
1 -
2
-
3
-
4
-
5
-
6
-
7
-
8
-
9
-
10
-
11
-
12
-
13
-
14
-
15
-
16
-
17
-
18
-
19
-
20
-
21
-
22
-
23
-
24
-
25
-
26
-
27
-
28
-
29
-
30
-
31
-
32
-
33
-
34
-
35
-
36
-
37
-
38
-
39
-
40
-
41
-
42
-
43
-
44
-
45
-
46
-
47
-
48
-
49
-
50
-
51
-
52
-
53
-
54
-
55
-
56
-
57
-
58
-
59
-
60
-
61
-
62
-
63
-
64
-
65
-
66
-
67
-
68
-
69
-
70
-
71
-
72
-
73
-
74
-
75
-
76
-
77
-
78
-
79
-
80
-
81
-
82
-
83
-
84
-
85
-
86
-
87
-
88
-
89
-
90
-
91
-
92
-
93
-
94
-
95
-
96
-
97
-
98
-
99
-
100
-
101
-
102
-
103
-
104
-
105
-
106
-
107
-
108
-
109
-
110
-
111
-
112
-
113
-
114
-
115
-
116
-
117
-
118
-
119
-
120
-
121
-
122
-
123
-
124
-
125
-
126
-
127
-
128
-
129
-
130
-
131
-
132
-
133
-
134
-
135
-
136
-
137
-
 138
138 -
 139
139 -
 140
140 -
 141
141 -
 142
142 -
 143
143 -
 144
144 -
 145
145 -
 146
146 -
 147
147 -
 148
148 -
 149
149 -
 150
150 -
 151
151 -
 152
152 -
 153
153 -
 154
154 -
 155
155 -
 156
156 -
 157
157 -
 158
158 -
159
-
160
-
161
-
162
-
163
-
164
-
165
-
166
-
167
-
168
-
169
-
170
-
171
-
172
-
173
-
174
-
175
-
176
-
177
-
178
-
179
-
180
-
181
-
182
-
183
-
184
-
185
-
186
-
187
-
188
-
189
-
190
-
191
-
192
-
193
-
194
-
195
-
196
-
197
-
198
-
199
-
200
-
201
-
202
-
203
-
204
-
205
-
206
-
207
-
208
-
209
-
210
-
211
-
212
-
213
 |
 |

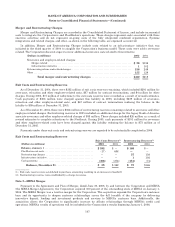
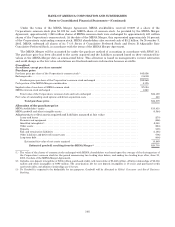
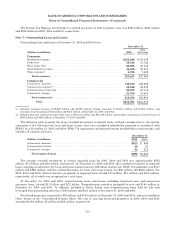
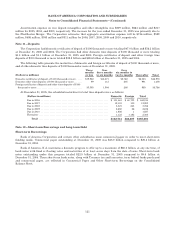
BANK OF AMERICA CORPORATION AND SUBSIDIARIES
Notes to Consolidated Financial Statements—(Continued)
Note 6 – Securities
The amortized cost, gross unrealized gains and losses, and fair value of AFS debt and marketable equity securities,
and Held-to-maturity securities at December 31, 2005, 2004 and 2003 were:
(Dollars in millions) Amortized
Cost
Gross
Unrealized
Gains
Gross
Unrealized
Losses Fair
Value
Available-for-sale securities
2005
U.S. Treasury securities and agency debentures ....................... $ 730 $ — $ 13 $ 717
Mortgage-backed securities ......................................... 197,101 198 5,268 192,031
Foreign securities ................................................. 10,944 1 54 10,891
Other taxable securities(1) .......................................... 13,198 126 99 13,225
Total taxable ................................................. 221,973 325 5,434 216,864
Tax-exempt securities ............................................. 4,693 31 32 4,692
Total available-for-sale securities ............................ $226,666 $356 $5,466 $221,556
Available-for-sale marketable equity securities(2) ......... $ 4,060 $305 $ 18 $ 4,347
2004
U.S. Treasury securities and agency debentures ....................... $ 826 $ — $ 1 $ 825
Mortgage-backed securities ......................................... 173,697 174 624 173,247
Foreign securities ................................................. 7,437 36 26 7,447
Other taxable securities(1) .......................................... 9,493 — 13 9,480
Total taxable ................................................. 191,453 210 664 190,999
Tax-exempt securities ............................................. 3,662 87 5 3,744
Total available-for-sale securities ............................ $ 195,115 $ 297 $ 669 $ 194,743
Available-for-sale marketable equity securities(2) ......... $ 3,571 $ 32 $ 2 $ 3,601
2003
U.S. Treasury securities and agency debentures ....................... $ 710 $ 5 $ 2 $ 713
Mortgage-backed securities ......................................... 56,403 63 575 55,891
Foreign securities ................................................. 2,816 23 38 2,801
Other taxable securities(3) .......................................... 4,765 36 69 4,732
Total taxable ................................................. 64,694 127 684 64,137
Tax-exempt securities ............................................. 2,167 79 1 2,245
Total available-for-sale securities ............................ $ 66,861 $206 $ 685 $ 66,382
Available-for-sale marketable equity securities(2) ................. $ 2,803 $394 $ 31 $ 3,166
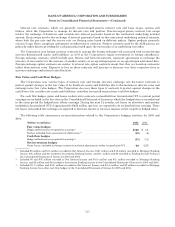
Held-to-maturity securities
2005
Taxable securities ................................................. $4$— $—$4
Tax-exempt securities ............................................. 43 — — 43
Total held-to-maturity securities ............................. $47 $— $—$47
2004
Taxable securities ................................................. $ 41 $ 4 $ 4 $ 41
Tax-exempt securities ............................................. 289 — 1 288
Total held-to-maturity securities ............................. $ 330 $ 4 $ 5 $ 329
2003
Taxable securities ................................................. $ 96 $ 3 $ 3 $ 96
Tax-exempt securities ............................................. 151 7 — 158
Total held-to-maturity securities ............................. $ 247 $ 10 $ 3 $ 254
(1) Includes corporate debt, asset-backed securities and equity instruments.
(2) Represents those AFS marketable equity securities that are recorded in Other Assets on the Consolidated Balance Sheet.
(3) Includes corporate debt and asset-backed securities.
112