Bank of America 2005 Annual Report Download - page 59
Download and view the complete annual report
Please find page 59 of the 2005 Bank of America annual report below. You can navigate through the pages in the report by either clicking on the pages listed below, or by using the keyword search tool below to find specific information within the annual report.-
 1
1 -
2
-
3
-
4
-
5
-
6
-
7
-
8
-
9
-
10
-
11
-
12
-
13
-
14
-
15
-
16
-
17
-
18
-
19
-
20
-
21
-
22
-
23
-
24
-
25
-
26
-
27
-
28
-
29
-
30
-
31
-
32
-
33
-
34
-
35
-
36
-
37
-
38
-
39
-
40
-
41
-
42
-
43
-
44
-
45
-
46
-
47
-
48
-
 49
49 -
 50
50 -
 51
51 -
 52
52 -
 53
53 -
 54
54 -
 55
55 -
 56
56 -
 57
57 -
 58
58 -
 59
59 -
 60
60 -
 61
61 -
 62
62 -
 63
63 -
 64
64 -
 65
65 -
 66
66 -
 67
67 -
 68
68 -
 69
69 -
70
-
71
-
72
-
73
-
74
-
75
-
76
-
77
-
78
-
79
-
80
-
81
-
82
-
83
-
84
-
85
-
86
-
87
-
88
-
89
-
90
-
91
-
92
-
93
-
94
-
95
-
96
-
97
-
98
-
99
-
100
-
101
-
102
-
103
-
104
-
105
-
106
-
107
-
108
-
109
-
110
-
111
-
112
-
113
-
114
-
115
-
116
-
117
-
118
-
119
-
120
-
121
-
122
-
123
-
124
-
125
-
126
-
127
-
128
-
129
-
130
-
131
-
132
-
133
-
134
-
135
-
136
-
137
-
138
-
139
-
140
-
141
-
142
-
143
-
144
-
145
-
146
-
147
-
148
-
149
-
150
-
151
-
152
-
153
-
154
-
155
-
156
-
157
-
158
-
159
-
160
-
161
-
162
-
163
-
164
-
165
-
166
-
167
-
168
-
169
-
170
-
171
-
172
-
173
-
174
-
175
-
176
-
177
-
178
-
179
-
180
-
181
-
182
-
183
-
184
-
185
-
186
-
187
-
188
-
189
-
190
-
191
-
192
-
193
-
194
-
195
-
196
-
197
-
198
-
199
-
200
-
201
-
202
-
203
-
204
-
205
-
206
-
207
-
208
-
209
-
210
-
211
-
212
-
213
 |
 |

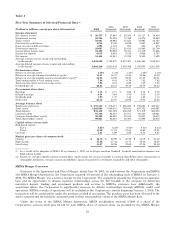
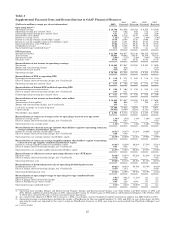
Table 2
Five-Year Summary of Selected Financial Data(1)
(Dollars in millions, except per share information) 2005 2004
(Restated) 2003
(Restated) 2002
(Restated) 2001
(Restated)
Income statement
Netinterestincome .......................................... $ 30,737 $ 27,960 $ 20,505 $ 20,117 $ 19,904
Noninterestincome .......................................... 25,354 21,005 17,329 14,874 15,863
Total revenue ............................................... 56,091 48,965 37,834 34,991 35,767
Provision for credit losses ..................................... 4,014 2,769 2,839 3,697 4,287
Gains on sales of debt securities ................................ 1,084 1,724 941 630 475
Noninterest expense .......................................... 28,681 27,012 20,155 18,445 20,709
Income before income taxes ................................... 24,480 20,908 15,781 13,479 11,246
Income tax expense .......................................... 8,015 6,961 5,019 3,926 3,747
Netincome .................................................. 16,465 13,947 10,762 9,553 7,499
Average common shares issued and outstanding
(in thousands) ............................................. 4,008,688 3,758,507 2,973,407 3,040,085 3,189,914
Average diluted common shares issued and outstanding
(in thousands) ............................................. 4,068,140 3,823,943 3,030,356 3,130,935 3,251,308
Performance ratios
Return on average assets ..................................... 1.30% 1.34% 1.44% 1.46% 1.16%
Return on average common shareholders’ equity ................. 16.51 16.47 21.50 19.96 15.42
Return on average tangible common shareholders’ equity(2) ........ 34.03 32.59 29.20 27.53 23.51
Total ending equity to total ending assets ....................... 7.86 9.03 6.76 7.92 7.92
Total average equity to total average assets ..................... 7.86 8.12 6.69 7.33 7.55
Dividend payout ............................................. 46.61 46.31 39.76 38.79 48.40
Per common share data
Earnings.................................................... $4.10$ 3.71 $ 3.62 $ 3.14 $ 2.35
Dilutedearnings ............................................. 4.04 3.64 3.55 3.05 2.30
Dividends paid .............................................. 1.90 1.70 1.44 1.22 1.14
Bookvalue .................................................. 25.32 24.70 16.86 17.04 15.63
Average balance sheet
Total loans and leases ........................................ $ 537,218 $ 472,617 $ 356,220 $ 336,820 $ 365,447
Total assets ................................................. 1,269,892 1,044,631 749,104 653,732 644,887
Total deposits ............................................... 632,432 551,559 406,233 371,479 362,653
Long-term debt .............................................. 97,709 92,303 67,077 65,550 69,621
Common shareholders’ equity ................................. 99,590 84,584 50,035 47,837 48,610
Total shareholders’ equity ..................................... 99,861 84,815 50,091 47,898 48,678
Capital ratios (at year end)
Risk-based capital:
Tier1................................................... 8.25% 8.20% 8.02% 8.41% 8.44%
Total ................................................... 11.08 11.73 12.05 12.63 12.81
Leverage .................................................... 5.91 5.89 5.86 6.44 6.67
Market price per share of common stock
Closing ..................................................... $ 46.15 $ 46.99 $ 40.22 $ 34.79 $ 31.48
Highclosing ................................................. 47.08 47.44 41.77 38.45 32.50
Lowclosing ................................................. 41.57 38.96 32.82 27.08 23.38
(1) As a result of the adoption of SFAS 142 on January 1, 2002, we no longer amortize Goodwill. Goodwill amortization expense was
$662 million in 2001.
(2) Return on average tangible common shareholders’ equity equals net income available to common shareholders plus amortization of
intangibles, divided by average common shareholders’ equity less goodwill, core deposit intangibles and other intangibles.
MBNA Merger Overview
Pursuant to the Agreement and Plan of Merger, dated June 30, 2005, by and between the Corporation and MBNA
(the MBNA Merger Agreement), the Corporation acquired 100 percent of the outstanding stock of MBNA on January 1,
2006. The MBNA Merger was a tax-free merger for the Corporation. The acquisition expands the Corporation’s customer
base and its opportunity to deepen customer relationships across the full breadth of the company by delivering
innovative deposit, lending and investment products and services to MBNA’s customer base. Additionally, the
acquisition allows the Corporation to significantly increase its affinity relationships through MBNA’s credit card
operations. MBNA’s results of operations will be included in the Corporation’s results beginning January 1, 2006. The
transaction will be accounted for under the purchase method of accounting. The purchase price has been allocated to the
assets acquired and the liabilities assumed based on their estimated fair values at the MBNA Merger date.
Under the terms of the MBNA Merger Agreement, MBNA stockholders received 0.5009 of a share of the
Corporation’s common stock plus $4.125 for each MBNA share of common stock. As provided by the MBNA Merger
23