Bank of America 2005 Annual Report Download - page 67
Download and view the complete annual report
Please find page 67 of the 2005 Bank of America annual report below. You can navigate through the pages in the report by either clicking on the pages listed below, or by using the keyword search tool below to find specific information within the annual report.-
 1
1 -
2
-
3
-
4
-
5
-
6
-
7
-
8
-
9
-
10
-
11
-
12
-
13
-
14
-
15
-
16
-
17
-
18
-
19
-
20
-
21
-
22
-
23
-
24
-
25
-
26
-
27
-
28
-
29
-
30
-
31
-
32
-
33
-
34
-
35
-
36
-
37
-
38
-
39
-
40
-
41
-
42
-
43
-
44
-
45
-
46
-
47
-
48
-
49
-
50
-
51
-
52
-
53
-
54
-
55
-
56
-
 57
57 -
 58
58 -
 59
59 -
 60
60 -
 61
61 -
 62
62 -
 63
63 -
 64
64 -
 65
65 -
 66
66 -
 67
67 -
 68
68 -
 69
69 -
 70
70 -
 71
71 -
 72
72 -
 73
73 -
 74
74 -
 75
75 -
 76
76 -
 77
77 -
78
-
79
-
80
-
81
-
82
-
83
-
84
-
85
-
86
-
87
-
88
-
89
-
90
-
91
-
92
-
93
-
94
-
95
-
96
-
97
-
98
-
99
-
100
-
101
-
102
-
103
-
104
-
105
-
106
-
107
-
108
-
109
-
110
-
111
-
112
-
113
-
114
-
115
-
116
-
117
-
118
-
119
-
120
-
121
-
122
-
123
-
124
-
125
-
126
-
127
-
128
-
129
-
130
-
131
-
132
-
133
-
134
-
135
-
136
-
137
-
138
-
139
-
140
-
141
-
142
-
143
-
144
-
145
-
146
-
147
-
148
-
149
-
150
-
151
-
152
-
153
-
154
-
155
-
156
-
157
-
158
-
159
-
160
-
161
-
162
-
163
-
164
-
165
-
166
-
167
-
168
-
169
-
170
-
171
-
172
-
173
-
174
-
175
-
176
-
177
-
178
-
179
-
180
-
181
-
182
-
183
-
184
-
185
-
186
-
187
-
188
-
189
-
190
-
191
-
192
-
193
-
194
-
195
-
196
-
197
-
198
-
199
-
200
-
201
-
202
-
203
-
204
-
205
-
206
-
207
-
208
-
209
-
210
-
211
-
212
-
213
 |
 |

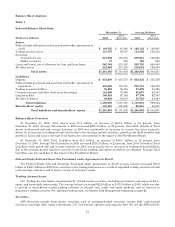
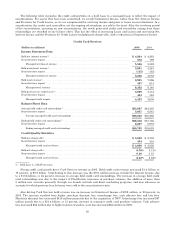
Held Provision for Credit Losses increased $887 million to $4.0 billion in 2005, driven primarily by higher net
charge-offs. Consumer card net charge-offs were $3.7 billion, or 6.76 percent in 2005 compared to $2.3 billion, or 5.31
percent in 2004. Higher credit card net charge-offs were driven by an increase in bankruptcy related charge-offs of $578
million as card customers “rushed to file” ahead of the new bankruptcy law. Also impacting net charge-offs were organic
portfolio growth and seasoning, increases effective in 2004 in credit card minimum payment requirements, the impact of
FleetBoston and new advances on accounts for which previous loan balances were sold to the securitization trusts. We
estimate that approximately 70 percent of the increased bankruptcy-related charge-offs represent acceleration from
2006. Excluding bankruptcy-related charge-offs representing acceleration from 2006 and charge-offs associated with the
2004 changes in credit card minimum payment requirements that were provided for in late 2004, the increased net
charge-offs were the primary driver of the higher Provision for Credit Losses. In addition, the Provision for Credit Losses
was impacted by new advances on accounts for which previous loan balances were sold to the securitization trusts, and
the establishment of reserves in 2005 for additional changes made in late 2005 in credit card minimum payment
requirements.
Managed card revenue increased $1.3 billion, or 15 percent, to $9.4 billion in 2005, driven by a $474 million, or nine
percent, increase in managed Net Interest Income, and a $778 million, or 25 percent increase, in managed Noninterest
Income. Average managed credit card outstandings were $59.0 billion in 2005 compared to $50.3 billion in 2004. The
impact of FleetBoston and organic growth drove the increases in 2005.
Managed consumer credit card net losses were $4.1 billion, or 6.92 percent of total average managed credit card
loans in 2005, compared to $2.8 billion, or 5.62 percent in 2004. Higher managed credit card net losses were driven by an
increase in bankruptcy net losses resulting from the change in the bankruptcy law, continued growth and seasoning,
increases effective in 2004 in credit card minimum payment requirements and the impact of FleetBoston. For more
information, see Credit Risk Management beginning on page 49.
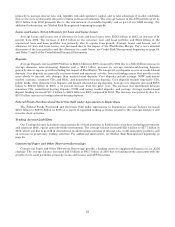
Consumer Real Estate
Consumer Real Estate generates revenue by providing an extensive line of mortgage products and services to
customers nationwide. Consumer Real Estate products are available to our customers through a retail network of
personal bankers located in 5,873 banking centers, dedicated sales account executives in over 150 locations and through
a dedicated sales force offering our customers direct telephone and online access to our products. Additionally, we serve
our customers through a partnership with more than 6,600 mortgage brokers in 49 states. The mortgage product
offerings for home purchase and refinancing needs include fixed and adjustable rate loans, and home equity lines of
credit. To manage this portfolio, these products are either sold into the secondary mortgage market to investors while
retaining Bank of America customer relationships or are held on our balance sheet for ALM purposes.
Consumer Real Estate is managed with a focus on its two primary businesses, first mortgage and home equity. The
first mortgage business includes the origination, fulfillment and servicing of first mortgage loan products. Servicing
activities primarily include collecting cash for principal, interest and escrow payments from borrowers, and accounting
for and remitting principal and interest payments to investors. Servicing income includes ancillary income derived in
connection with these activities, such as late fees. The home equity business includes lines of credit and second
mortgages. These two businesses provide us with a business model that meets customer real estate borrowing needs in
various interest rate cycles.
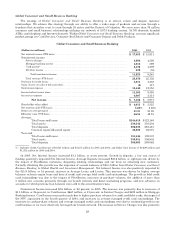
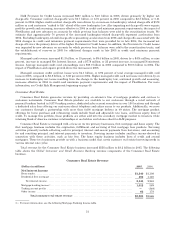
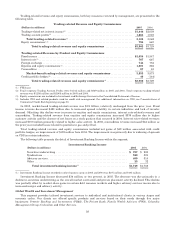
Total revenue for the Consumer Real Estate business increased $558 million to $3.2 billion in 2005. The following
table shows the Global Consumer and Small Business Banking revenue components of the Consumer Real Estate
business.
Consumer Real Estate Revenue
(Dollars in millions) 2005 2004
Net Interest Income
Homeequity................................................................................. $1,340 $1,108
Residential first mortgage ..................................................................... 806 1,140
Netinterestincome ....................................................................... 2,146 2,248
Mortgage banking income(1) .................................................................... 1,012 589
Trading account profits ....................................................................... —(349)
Otherincome ................................................................................ 66 178
Total consumer real estate revenue ................................................. $3,224 $2,666
(1) For more information, see the following Mortgage Banking Income table.
31