Bank of America 2005 Annual Report Download - page 78
Download and view the complete annual report
Please find page 78 of the 2005 Bank of America annual report below. You can navigate through the pages in the report by either clicking on the pages listed below, or by using the keyword search tool below to find specific information within the annual report.-
 1
1 -
2
-
3
-
4
-
5
-
6
-
7
-
8
-
9
-
10
-
11
-
12
-
13
-
14
-
15
-
16
-
17
-
18
-
19
-
20
-
21
-
22
-
23
-
24
-
25
-
26
-
27
-
28
-
29
-
30
-
31
-
32
-
33
-
34
-
35
-
36
-
37
-
38
-
39
-
40
-
41
-
42
-
43
-
44
-
45
-
46
-
47
-
48
-
49
-
50
-
51
-
52
-
53
-
54
-
55
-
56
-
57
-
58
-
59
-
60
-
61
-
62
-
63
-
64
-
65
-
66
-
67
-
 68
68 -
 69
69 -
 70
70 -
 71
71 -
 72
72 -
 73
73 -
 74
74 -
 75
75 -
 76
76 -
 77
77 -
 78
78 -
 79
79 -
 80
80 -
 81
81 -
 82
82 -
 83
83 -
 84
84 -
 85
85 -
 86
86 -
 87
87 -
 88
88 -
89
-
90
-
91
-
92
-
93
-
94
-
95
-
96
-
97
-
98
-
99
-
100
-
101
-
102
-
103
-
104
-
105
-
106
-
107
-
108
-
109
-
110
-
111
-
112
-
113
-
114
-
115
-
116
-
117
-
118
-
119
-
120
-
121
-
122
-
123
-
124
-
125
-
126
-
127
-
128
-
129
-
130
-
131
-
132
-
133
-
134
-
135
-
136
-
137
-
138
-
139
-
140
-
141
-
142
-
143
-
144
-
145
-
146
-
147
-
148
-
149
-
150
-
151
-
152
-
153
-
154
-
155
-
156
-
157
-
158
-
159
-
160
-
161
-
162
-
163
-
164
-
165
-
166
-
167
-
168
-
169
-
170
-
171
-
172
-
173
-
174
-
175
-
176
-
177
-
178
-
179
-
180
-
181
-
182
-
183
-
184
-
185
-
186
-
187
-
188
-
189
-
190
-
191
-
192
-
193
-
194
-
195
-
196
-
197
-
198
-
199
-
200
-
201
-
202
-
203
-
204
-
205
-
206
-
207
-
208
-
209
-
210
-
211
-
212
-
213
 |
 |

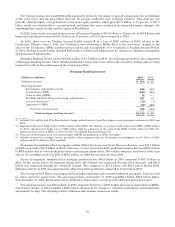
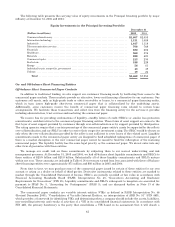
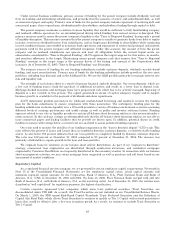
The following table presents the carrying value of equity investments in the Principal Investing portfolio by major
industry at December 31, 2005 and 2004:
Equity Investments in the Principal Investing Portfolio
December 31
(Dollars in millions) 2005 2004
Consumer discretionary ............................................................. $1,607 $2,058
Information technology .............................................................. 1,131 1,089
Industrials ......................................................................... 1,017 1,118
Telecommunicationservices.......................................................... 708 769
Financials ......................................................................... 632 606
Healthcare......................................................................... 560 576
Materials .......................................................................... 288 421
Consumer staples ................................................................... 213 230
Realestate......................................................................... 188 229
Energy ............................................................................ 56 81
Individual trusts, nonprofits, government .............................................. 43 49
Utilities ........................................................................... 19 24
Total ......................................................................... $6,462 $7,250
On- and Off-balance Sheet Financing Entities
Off-balance Sheet Commercial Paper Conduits
In addition to traditional lending, we also support our customers’ financing needs by facilitating their access to the
commercial paper markets. These markets provide an attractive, lower-cost financing alternative for our customers. Our
customers sell assets, such as high-grade trade or other receivables or leases, to a commercial paper financing entity,
which in turn issues high-grade short-term commercial paper that is collateralized by the underlying assets.
Additionally, some customers receive the benefit of commercial paper financing rates related to certain lease
arrangements. We facilitate these transactions and collect fees from the financing entity for the services it provides
including administration, trust services and marketing the commercial paper.
We receive fees for providing combinations of liquidity, standby letters of credit (SBLCs) or similar loss protection
commitments, and derivatives to the commercial paper financing entities. These forms of asset support are senior to the
first layer of asset support provided by customers through over-collateralization or by support provided by third parties.
The rating agencies require that a certain percentage of the commercial paper entity’s assets be supported by the seller’s
over-collateralization and our SBLC in order to receive their respective investment rating. The SBLC would be drawn on
only when the over-collateralization provided by the seller is not sufficient to cover losses of the related asset. Liquidity
commitments made to the commercial paper entity are designed to fund scheduled redemptions of commercial paper if
there is a market disruption or the new commercial paper cannot be issued to fund the redemption of the maturing
commercial paper. The liquidity facility has the same legal priority as the commercial paper. We do not enter into any
other form of guarantee with these entities.
We manage our credit risk on these commitments by subjecting them to our normal underwriting and risk
management processes. At December 31, 2005 and 2004, we had off-balance sheet liquidity commitments and SBLCs to
these entities of $25.9 billion and $23.8 billion. Substantially all of these liquidity commitments and SBLCs mature
within one year. These amounts are included in Table 6. Net revenues earned from fees associated with these off-balance
sheet financing entities were approximately $71 million and $80 million in 2005 and 2004.
From time to time, we may purchase some of the commercial paper issued by certain of these entities for our own
account or acting as a dealer on behalf of third parties. Derivative instruments related to these entities are marked to
market through the Consolidated Statement of Income. SBLCs are initially recorded at fair value in accordance with
Financial Accounting Standards Board (FASB) Interpretation No. 45, “Guarantor’s Accounting and Disclosure
Requirements for Guarantees” (FIN 45). Liquidity commitments and SBLCs subsequent to inception are accounted for
pursuant to SFAS No. 5, “Accounting for Contingencies” (SFAS 5), and are discussed further in Note 13 of the
Consolidated Financial Statements.
The commercial paper conduits are variable interest entities (VIEs) as defined in FASB Interpretation No. 46
(Revised December 2003), “Consolidation of Variable Interest Entities, an interpretation of ARB No. 51” (FIN 46R),
which provides a framework for identifying VIEs and determining when a company should include the assets, liabilities,
non-controlling interests and results of activities of a VIE in its consolidated financial statements. In accordance with
FIN 46R, the primary beneficiary is the party that consolidates a VIE based on its assessment that it will absorb a
42