Bank of America 2005 Annual Report Download - page 57
Download and view the complete annual report
Please find page 57 of the 2005 Bank of America annual report below. You can navigate through the pages in the report by either clicking on the pages listed below, or by using the keyword search tool below to find specific information within the annual report.-
 1
1 -
2
-
3
-
4
-
5
-
6
-
7
-
8
-
9
-
10
-
11
-
12
-
13
-
14
-
15
-
16
-
17
-
18
-
19
-
20
-
21
-
22
-
23
-
24
-
25
-
26
-
27
-
28
-
29
-
30
-
31
-
32
-
33
-
34
-
35
-
36
-
37
-
38
-
39
-
40
-
41
-
42
-
43
-
44
-
45
-
46
-
 47
47 -
 48
48 -
 49
49 -
 50
50 -
 51
51 -
 52
52 -
 53
53 -
 54
54 -
 55
55 -
 56
56 -
 57
57 -
 58
58 -
 59
59 -
 60
60 -
 61
61 -
 62
62 -
 63
63 -
 64
64 -
 65
65 -
 66
66 -
 67
67 -
68
-
69
-
70
-
71
-
72
-
73
-
74
-
75
-
76
-
77
-
78
-
79
-
80
-
81
-
82
-
83
-
84
-
85
-
86
-
87
-
88
-
89
-
90
-
91
-
92
-
93
-
94
-
95
-
96
-
97
-
98
-
99
-
100
-
101
-
102
-
103
-
104
-
105
-
106
-
107
-
108
-
109
-
110
-
111
-
112
-
113
-
114
-
115
-
116
-
117
-
118
-
119
-
120
-
121
-
122
-
123
-
124
-
125
-
126
-
127
-
128
-
129
-
130
-
131
-
132
-
133
-
134
-
135
-
136
-
137
-
138
-
139
-
140
-
141
-
142
-
143
-
144
-
145
-
146
-
147
-
148
-
149
-
150
-
151
-
152
-
153
-
154
-
155
-
156
-
157
-
158
-
159
-
160
-
161
-
162
-
163
-
164
-
165
-
166
-
167
-
168
-
169
-
170
-
171
-
172
-
173
-
174
-
175
-
176
-
177
-
178
-
179
-
180
-
181
-
182
-
183
-
184
-
185
-
186
-
187
-
188
-
189
-
190
-
191
-
192
-
193
-
194
-
195
-
196
-
197
-
198
-
199
-
200
-
201
-
202
-
203
-
204
-
205
-
206
-
207
-
208
-
209
-
210
-
211
-
212
-
213
 |
 |

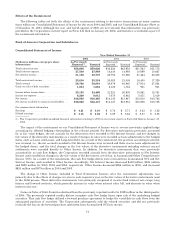
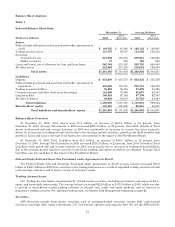
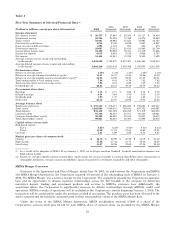
Balance Sheet Analysis
Table 1
Selected Balance Sheet Data
December 31 Average Balance
(Dollars in millions) 2005 2004
(Restated) 2005 2004
(Restated)
Assets
Federal funds sold and securities purchased under agreements to
resell .................................................... $ 149,785 $ 91,360 $ 169,132 $ 128,981
Trading account assets ....................................... 131,707 93,587 133,502 104,616
Securities:
Available-for-sale ........................................ 221,556 194,743 219,651 149,628
Held-to-maturity ........................................ 47 330 192 543
Loans and leases, net of allowance for loan and lease losses ....... 565,746 513,187 528,793 464,408
All other assets ............................................. 222,962 217,225 218,622 196,455
Total assets .................................... $1,291,803 $1,110,432 $1,269,892 $1,044,631
Liabilities
Deposits ................................................... $ 634,670 $ 618,570 $ 632,432 $ 551,559
Federal funds purchased and securities sold under agreements to
repurchase ............................................... 240,655 119,741 230,751 165,218
Trading account liabilities .................................... 50,890 36,654 57,689 35,326
Commercial paper and other short-term borrowings ............. 116,269 78,598 95,657 62,347
Long-term debt ............................................. 100,848 97,116 97,709 92,303
All other liabilities .......................................... 46,938 59,518 55,793 53,063
Total liabilities .................................... 1,190,270 1,010,197 1,170,031 959,816
Shareholders’ equity ...................................... 101,533 100,235 99,861 84,815
Total liabilities and shareholders’ equity ....... $1,291,803 $1,110,432 $1,269,892 $1,044,631
Balance Sheet Overview
At December 31, 2005, Total Assets were $1.3 trillion, an increase of $181.4 billion, or 16 percent, from
December 31, 2004. Average Total Assets in 2005 increased $225.3 billion, or 22 percent, from 2004. Growth in Total
Assets (both period end and average balances) in 2005 was attributable to increases in various line items primarily
driven by an increase in trading-related activity due to the strategic growth initiative, growth in the ALM portfolio and
growth in Loans and Leases. Average Total Assets also increased due to the impact of the FleetBoston Merger.
At December 31, 2005, Total Liabilities were $1.2 trillion, an increase of $180.1 billion, or 18 percent, from
December 31, 2004. Average Total Liabilities in 2005 increased $210.2 billion, or 22 percent, from 2004. Growth in Total
Liabilities (both period end and average balances) in 2005 was primarily due to increases in trading-related liabilities
due to the strategic growth initiative, increase in wholesale funding and organic growth in core deposits. Average Total
Liabilities also increased due to the impact of the FleetBoston Merger.
Federal Funds Sold and Securities Purchased under Agreements to Resell
The Federal Funds Sold and Securities Purchased under Agreements to Resell average balance increased $40.2
billion to $169.1 billion in 2005 from activities in the trading businesses as a result of expanded trading activities related
to the strategic initiative and to meet a variety of customers’ needs.
Trading Account Assets
Our Trading Account Assets consist primarily of fixed income securities (including government and corporate debt),
equity and convertible instruments. The average balance increased $28.9 billion to $133.5 billion in 2005, which was due
to growth in client-driven market-making activities in interest rate, credit and equity products, and an increase in
proprietary trading activities. For additional information, see Market Risk Management beginning on page 65.
Securities
AFS Securities include fixed income securities such as mortgage-backed securities, foreign debt, asset-backed
securities, municipal debt, equity instruments, U.S. Government agencies and corporate debt. We use the AFS portfolio
21