Bank of America 2005 Annual Report Download - page 121
Download and view the complete annual report
Please find page 121 of the 2005 Bank of America annual report below. You can navigate through the pages in the report by either clicking on the pages listed below, or by using the keyword search tool below to find specific information within the annual report.-
 1
1 -
2
-
3
-
4
-
5
-
6
-
7
-
8
-
9
-
10
-
11
-
12
-
13
-
14
-
15
-
16
-
17
-
18
-
19
-
20
-
21
-
22
-
23
-
24
-
25
-
26
-
27
-
28
-
29
-
30
-
31
-
32
-
33
-
34
-
35
-
36
-
37
-
38
-
39
-
40
-
41
-
42
-
43
-
44
-
45
-
46
-
47
-
48
-
49
-
50
-
51
-
52
-
53
-
54
-
55
-
56
-
57
-
58
-
59
-
60
-
61
-
62
-
63
-
64
-
65
-
66
-
67
-
68
-
69
-
70
-
71
-
72
-
73
-
74
-
75
-
76
-
77
-
78
-
79
-
80
-
81
-
82
-
83
-
84
-
85
-
86
-
87
-
88
-
89
-
90
-
91
-
92
-
93
-
94
-
95
-
96
-
97
-
98
-
99
-
100
-
101
-
102
-
103
-
104
-
105
-
106
-
107
-
108
-
109
-
110
-
 111
111 -
 112
112 -
 113
113 -
 114
114 -
 115
115 -
 116
116 -
 117
117 -
 118
118 -
 119
119 -
 120
120 -
 121
121 -
 122
122 -
 123
123 -
 124
124 -
 125
125 -
 126
126 -
 127
127 -
 128
128 -
 129
129 -
 130
130 -
 131
131 -
132
-
133
-
134
-
135
-
136
-
137
-
138
-
139
-
140
-
141
-
142
-
143
-
144
-
145
-
146
-
147
-
148
-
149
-
150
-
151
-
152
-
153
-
154
-
155
-
156
-
157
-
158
-
159
-
160
-
161
-
162
-
163
-
164
-
165
-
166
-
167
-
168
-
169
-
170
-
171
-
172
-
173
-
174
-
175
-
176
-
177
-
178
-
179
-
180
-
181
-
182
-
183
-
184
-
185
-
186
-
187
-
188
-
189
-
190
-
191
-
192
-
193
-
194
-
195
-
196
-
197
-
198
-
199
-
200
-
201
-
202
-
203
-
204
-
205
-
206
-
207
-
208
-
209
-
210
-
211
-
212
-
213
 |
 |

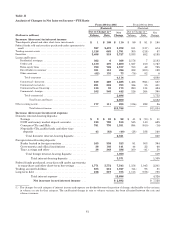
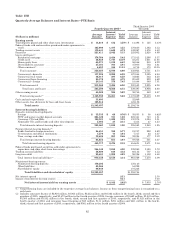
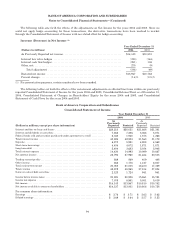
Table VIII
Quarterly Average Balances and Interest Rates—FTE Basis
Fourth Quarter 2005(5)
Third Quarter 2005
(Restated)
(Dollars in millions) Average
Balance
Interest
Income/
Expense Yield/
Rate Average
Balance
Interest
Income/
Expense Yield/
Rate
Earning assets
Time deposits placed and other short-term investments ............. $ 14,619 $ 132 3.59% $ 14,498 $ 125 3.43%
Federal funds sold and securities purchased under agreements to
resell ....................................................... 165,908 1,477 3.55 176,650 1,382 3.12
Trading account assets ......................................... 139,441 1,648 4.72 142,287 1,578 4.42
Securities ..................................................... 221,411 2,842 5.13 225,952 2,820 4.99
Loans and leases(1):
Residential mortgage ......................................... 178,764 2,424 5.42 171,012 2,298 5.37
Creditcard.................................................. 56,858 1,747 12.19 55,271 1,651 11.85
Homeequitylines............................................ 60,571 1,012 6.63 58,046 910 6.22
Direct/Indirect consumer ..................................... 47,181 703 5.91 47,900 702 5.81
Other consumer(2) ............................................ 6,653 184 11.01 6,715 170 10.05
Total consumer ............................................ 350,027 6,070 6.90 338,944 5,731 6.73
Commercial—domestic ....................................... 137,224 2,280 6.59 127,044 2,095 6.54
Commercial real estate ....................................... 36,017 597 6.58 34,663 542 6.20
Commercial lease financing ................................... 20,178 241 4.79 20,402 239 4.69
Commercial—foreign ......................................... 20,143 378 7.45 18,444 349 7.51
Total commercial .......................................... 213,562 3,496 6.50 200,553 3,225 6.38
Total loans and leases .................................... 563,589 9,566 6.75 539,497 8,956 6.60
Other earning assets ........................................... 40,582 596 5.83 38,745 542 5.57
Total earning assets(3) ...................................... 1,145,550 16,261 5.65 1,137,629 15,403 5.39
Cash and cash equivalents ...................................... 33,693 32,969
Other assets, less allowance for loan and lease losses ............... 125,814 124,156
Total assets .......................................... $1,305,057 $1,294,754
Interest-bearing liabilities
Domestic interest-bearing deposits:
Savings ..................................................... $ 35,535 $ 68 0.76% $ 35,853 $ 56 0.62%
NOW and money market deposit accounts ....................... 224,122 721 1.28 224,341 743 1.31
Consumer CDs and IRAs ..................................... 120,321 1,029 3.39 130,975 1,094 3.31
Negotiable CDs, public funds and other time deposits ............. 5,085 27 2.13 4,414 47 4.23
Total domestic interest-bearing deposits ...................... 385,063 1,845 1.90 395,583 1,940 1.95
Foreign interest-bearing deposits(4):
Banks located in foreign countries ............................. 24,451 355 5.77 19,707 292 5.89
Governments and official institutions ........................... 7,579 73 3.84 7,317 62 3.37
Time, savings and other ...................................... 32,624 203 2.46 32,024 177 2.19
Total foreign interest-bearing deposits ........................ 64,654 631 3.87 59,048 531 3.57
Total interest-bearing deposits ............................. 449,717 2,476 2.18 454,631 2,471 2.16
Federal funds purchased, securities sold under agreements to
repurchase and other short-term borrowings .................... 364,140 3,855 4.20 339,980 3,190 3.72
Trading account liabilities ...................................... 56,880 619 4.32 68,132 707 4.12
Long-term debt ................................................ 99,601 1,209 4.85 98,326 1,102 4.48
Total interest-bearing liabilities(3) .............................. 970,338 8,159 3.34 961,069 7,470 3.09
Noninterest-bearing sources:
Noninterest-bearing deposits .................................. 179,205 178,140
Other liabilities .............................................. 55,566 54,299
Shareholders’ equity ......................................... 99,948 101,246
Total liabilities and shareholders’ equity .............. $1,305,057 $1,294,754
Netinterestspread ............................................ 2.31 2.30
Impact of noninterest-bearing sources ............................ 0.51 0.48
Net interest income/yield on earning assets ........... $ 8,102 2.82% $ 7,933 2.78%
(1) Nonperforming loans are included in the respective average loan balances. Income on these nonperforming loans is recognized on a
cash basis.
(2) Includes consumer finance of $2,916 million, $3,063 million, $3,212 million and $3,362 million in the fourth, third, second and first
quarters of 2005, respectively, and $3,473 million in the fourth quarter of 2004; foreign consumer of $3,682 million, $3,541 million,
$3,505 million and $3,532 million in the fourth, third, second and first quarters of 2005, respectively, and $3,523 million in the
fourth quarter of 2004; and consumer lease financing of $55 million, $111 million, $251 million and $411 million in the fourth,
third, second and first quarters of 2005, respectively, and $561 million in the fourth quarter of 2004.
85