Bank of America 2005 Annual Report Download - page 199
Download and view the complete annual report
Please find page 199 of the 2005 Bank of America annual report below. You can navigate through the pages in the report by either clicking on the pages listed below, or by using the keyword search tool below to find specific information within the annual report.-
 1
1 -
2
-
3
-
4
-
5
-
6
-
7
-
8
-
9
-
10
-
11
-
12
-
13
-
14
-
15
-
16
-
17
-
18
-
19
-
20
-
21
-
22
-
23
-
24
-
25
-
26
-
27
-
28
-
29
-
30
-
31
-
32
-
33
-
34
-
35
-
36
-
37
-
38
-
39
-
40
-
41
-
42
-
43
-
44
-
45
-
46
-
47
-
48
-
49
-
50
-
51
-
52
-
53
-
54
-
55
-
56
-
57
-
58
-
59
-
60
-
61
-
62
-
63
-
64
-
65
-
66
-
67
-
68
-
69
-
70
-
71
-
72
-
73
-
74
-
75
-
76
-
77
-
78
-
79
-
80
-
81
-
82
-
83
-
84
-
85
-
86
-
87
-
88
-
89
-
90
-
91
-
92
-
93
-
94
-
95
-
96
-
97
-
98
-
99
-
100
-
101
-
102
-
103
-
104
-
105
-
106
-
107
-
108
-
109
-
110
-
111
-
112
-
113
-
114
-
115
-
116
-
117
-
118
-
119
-
120
-
121
-
122
-
123
-
124
-
125
-
126
-
127
-
128
-
129
-
130
-
131
-
132
-
133
-
134
-
135
-
136
-
137
-
138
-
139
-
140
-
141
-
142
-
143
-
144
-
145
-
146
-
147
-
148
-
149
-
150
-
151
-
152
-
153
-
154
-
155
-
156
-
157
-
158
-
159
-
160
-
161
-
162
-
163
-
164
-
165
-
166
-
167
-
168
-
169
-
170
-
171
-
172
-
173
-
174
-
175
-
176
-
177
-
178
-
179
-
180
-
181
-
182
-
183
-
184
-
185
-
186
-
187
-
188
-
 189
189 -
 190
190 -
 191
191 -
 192
192 -
 193
193 -
 194
194 -
 195
195 -
 196
196 -
 197
197 -
 198
198 -
 199
199 -
 200
200 -
 201
201 -
 202
202 -
 203
203 -
 204
204 -
 205
205 -
 206
206 -
 207
207 -
 208
208 -
 209
209 -
210
-
211
-
212
-
213
 |
 |

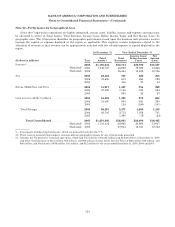
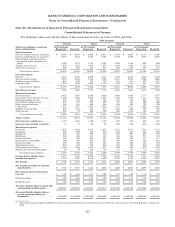
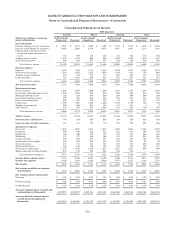
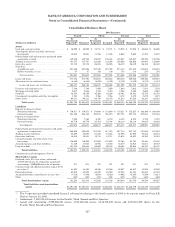
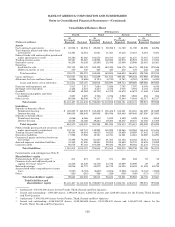
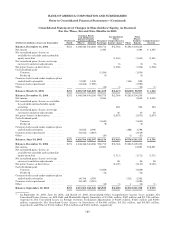
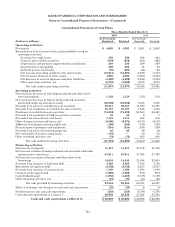
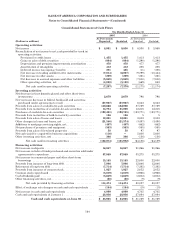
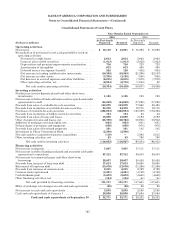
BANK OF AMERICA CORPORATION AND SUBSIDIARIES
Notes to Consolidated Financial Statements—(Continued)
Consolidated Statement of Cash Flows
Three Months Ended March 31
2005 2004
(Dollars in millions) As Previously
Reported Restated As Previously
Reported Restated
Operating activities
Netincome ................................................. $ 4,695 $ 4,393 $ 2,681 $ 2,648
Reconciliation of net income to net cash provided by (used in)
operating activities:
Provision for credit losses ................................. 580 580 624 624
Gains on sales of debt securities ........................... (659) (659) (495) (495)
Depreciation and premises improvements amortization ....... 240 240 209 209
Amortization of intangibles ............................... 208 208 54 54
Deferred income tax benefit ............................... (85) (267) (66) (86)
Net increase in trading and derivative instruments ........... (13,041) (12,697) (8,528) (7,475)
Net (increase) decrease in other assets ...................... 4,283 4,283 (5,063) (5,063)
Net decrease in accrued expenses and other liabilities ........ (4,489) (4,489) (8,252) (8,252)
Other operating activities, net ............................. (3,707) (3,669) 3,275 2,275
Net cash used in operating activities .................... (11,975) (12,077) (15,561) (15,561)
Investing activities
Net (increase) decrease in time deposits placed and other short-
term investments .......................................... 1,138 1,138 (510) (510)
Net (increase) decrease in federal funds sold and securities
purchased under agreements to resell ........................ (48,036) (48,036) 3,435 3,435
Proceeds from sales of available-for-sale securities ............... 38,451 38,451 11,090 11,090
Proceeds from maturities of available-for-sale securities .......... 10,181 10,181 1,848 1,848
Purchases of available-for-sale securities ........................ (74,552) (74,552) (84,567) (84,567)
Proceeds from maturities of held-to-maturity securities ........... 55 55 55
Proceeds from sales of loans and leases ......................... 1,113 1,113 876 876
Other changes in loans and leases, net .......................... (9,560) (9,574) (6,133) (6,133)
Additions to mortgage servicing rights, net ...................... (168) (168) (249) (249)
Net purchases of premises and equipment ...................... (254) (254) (249) (249)
Proceeds from sales of foreclosed properties ..................... 26 26 49 49
Net cash paid for business acquisitions ......................... (116) — (15) (15)
Other investing activities, net ................................. (72) (72) 800 800
Net cash used in investing activities .................... (81,794) (81,692) (73,620) (73,620)
Financing activities
Net increase in deposits ...................................... 11,417 11,417 21,479 21,479
Net increase in federal funds purchased and securities sold under
agreements to repurchase ................................... 67,911 67,911 37,388 37,388
Net increase in commercial paper and other short-term
borrowings ................................................ 14,842 14,842 21,634 21,634
Proceeds from issuance of long-term debt ....................... 4,768 4,768 7,558 7,558
Retirement of long-term debt .................................. (2,702) (2,702) (2,507) (2,507)
Proceeds from issuance of common stock ........................ 1,180 1,180 1,000 1,000
Common stock repurchased ................................... (1,990) (1,990) (973) (973)
Cashdividendspaid ......................................... (1,835) (1,835) (1,159) (1,159)
Other financing activities, net ................................. (37) (37) (23) (23)
Net cash provided by financing activities ................ 93,554 93,554 84,397 84,397
Effect of exchange rate changes on cash and cash equivalents ...... (23) (23) (4) (4)
Net decrease in cash and cash equivalents ...................... (238) (238) (4,788) (4,788)
Cash and cash equivalents at January 1 ........................ 28,936 28,936 27,084 27,084
Cash and cash equivalents at March 31 .......... $ 28,698 $ 28,698 $ 22,296 $ 22,296
163