Bank of America 2005 Annual Report Download - page 66
Download and view the complete annual report
Please find page 66 of the 2005 Bank of America annual report below. You can navigate through the pages in the report by either clicking on the pages listed below, or by using the keyword search tool below to find specific information within the annual report.-
 1
1 -
2
-
3
-
4
-
5
-
6
-
7
-
8
-
9
-
10
-
11
-
12
-
13
-
14
-
15
-
16
-
17
-
18
-
19
-
20
-
21
-
22
-
23
-
24
-
25
-
26
-
27
-
28
-
29
-
30
-
31
-
32
-
33
-
34
-
35
-
36
-
37
-
38
-
39
-
40
-
41
-
42
-
43
-
44
-
45
-
46
-
47
-
48
-
49
-
50
-
51
-
52
-
53
-
54
-
55
-
 56
56 -
 57
57 -
 58
58 -
 59
59 -
 60
60 -
 61
61 -
 62
62 -
 63
63 -
 64
64 -
 65
65 -
 66
66 -
 67
67 -
 68
68 -
 69
69 -
 70
70 -
 71
71 -
 72
72 -
 73
73 -
 74
74 -
 75
75 -
 76
76 -
77
-
78
-
79
-
80
-
81
-
82
-
83
-
84
-
85
-
86
-
87
-
88
-
89
-
90
-
91
-
92
-
93
-
94
-
95
-
96
-
97
-
98
-
99
-
100
-
101
-
102
-
103
-
104
-
105
-
106
-
107
-
108
-
109
-
110
-
111
-
112
-
113
-
114
-
115
-
116
-
117
-
118
-
119
-
120
-
121
-
122
-
123
-
124
-
125
-
126
-
127
-
128
-
129
-
130
-
131
-
132
-
133
-
134
-
135
-
136
-
137
-
138
-
139
-
140
-
141
-
142
-
143
-
144
-
145
-
146
-
147
-
148
-
149
-
150
-
151
-
152
-
153
-
154
-
155
-
156
-
157
-
158
-
159
-
160
-
161
-
162
-
163
-
164
-
165
-
166
-
167
-
168
-
169
-
170
-
171
-
172
-
173
-
174
-
175
-
176
-
177
-
178
-
179
-
180
-
181
-
182
-
183
-
184
-
185
-
186
-
187
-
188
-
189
-
190
-
191
-
192
-
193
-
194
-
195
-
196
-
197
-
198
-
199
-
200
-
201
-
202
-
203
-
204
-
205
-
206
-
207
-
208
-
209
-
210
-
211
-
212
-
213
 |
 |

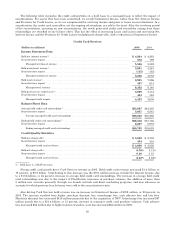
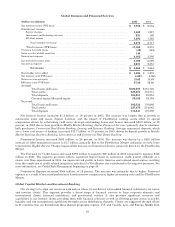
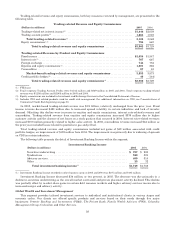
The following table reconciles the credit card portfolio on a held basis to a managed basis to reflect the impact of
securitizations. For assets that have been securitized, we record Noninterest Income, rather than Net Interest Income
and Provision for Credit Losses, as we are compensated for servicing income and gains or losses on securitizations. In a
securitization, the credit card receivables, not the ongoing relationships, are sold to the trust. After the revolving period
of the securitization, assuming no new securitizations, the newly generated credit card receivables arising from these
relationships are recorded on our balance sheet. This has the effect of increasing Loans and Leases and increasing Net
Interest Income and the Provision for Credit Losses (including net charge-offs), with a reduction in Noninterest Income.
Credit Card Services
(Dollars in millions) 2005 2004
Income Statement Data
Held net interest income(1) .................................................................. $ 4,984 $ 4,283
Securitizations impact ...................................................................... 572 799
Managed net interest income ............................................................ 5,556 5,082
Held noninterest income(1) .................................................................. 3,951 3,243
Securitizations impact ...................................................................... (115) (185)
Managed noninterest income ............................................................ 3,836 3,058
Held total revenue(1) ........................................................................ 8,935 7,526
Securitizations impact ...................................................................... 457 614
Managed total revenue ................................................................. 9,392 8,140
Held provision for credit losses(1) ............................................................. 3,999 3,112
Securitizations impact ...................................................................... 434 524
Managed credit impact ................................................................. 4,433 3,636
Balance Sheet Data
Average held credit card outstandings(1) ...................................................... $53,997 $43,435
Securitizations impact ...................................................................... 5,051 6,861
Average managed credit card outstandings ................................................ $59,048 $50,296
Ending held credit card outstandings(1) ....................................................... $58,548 $51,726
Securitizations impact ...................................................................... 2,237 6,903
Ending managed credit card outstandings ................................................. $60,785 $58,629
Credit Quality Statistics
Held net charge-offs(1) ...................................................................... $ 3,652 $ 2,305
Securitizations impact ...................................................................... 434 524
Managed credit card net losses ........................................................... $ 4,086 $ 2,829
Held net charge-offs(1) ...................................................................... 6.76% 5.31%
Securitizations impact ...................................................................... 0.16 0.31
Managed credit card net losses ........................................................... 6.92% 5.62%
(1) Held basis is a GAAP measure.
Strong credit card growth drove Card Services revenue in 2005. Held credit card revenue increased $1.4 billion, or
19 percent, to $8.9 billion. Contributing to this increase was the $701 million increase in held Net Interest Income, due
to a $10.6 billion, or 24 percent, increase in average held credit card outstandings. The increase in average held credit
card outstandings was due to the impact of FleetBoston, increases in purchase volumes, the addition of more than
5 million new accounts primarily through our branch network and direct marketing programs, and new advances on
accounts for which previous loan balances were sold to the securitization trusts.
Also driving Card Services held revenue was an increase in Noninterest Income of $708 million, or 22 percent, in
2005. The increase resulted from higher merchant discount fees, interchange fees, cash advance fees and late fees.
Merchant discount fees increased $418 million primarily due to the acquisition of NPC. Interchange fees increased $87
million mainly due to a $10.4 billion, or 13 percent, increase in consumer credit card purchase volumes. Cash advance
fees increased $64 million due to higher balance transfers. Late fees increased $62 million in 2005.
30